What is a Pan-STARRS1 discovered superluminous supernovae and why they matter in 2026
Explore Pan-STARRS1 discovered superluminous supernovae, their catalogs, luminosity functions, and key spectral features as of 2026. A concise explainer for students.
PS1 SLSNe exceed the luminosity of typical supernovae by a factor of tens, yet their powering stories are stubbornly complex. The most luminous events press against the boundaries of nickel decay, magnetar input, and interaction with surrounding material, and catalogs from Pan-STARRS1 reveal a puzzling mix of light curves that refuse easy classification.
In 2026, those catalogs sharpen a single point: the extremes force a tighter test of models. This piece parses the spectral fingerprints and light-curve morphologies that distinguish magnetar-powered from interaction-powered cases, and it shows why the apparent cap on luminosity matters for rates, progenitor environments, and the physics in the explosions’ last act. What the data say now matters for guiding theory, not just cataloging events. Pan-STARRS1 catalogs are the lens through which researchers judge which powering mechanism dominates under different conditions, and they set the stage for next-generation transient surveys.

Key definitions and scope of PS1 SLSNe
| Term | Definition | Relevance to PS1 SLSNe | Notes |
|---|---|---|---|
| Pan-STARRS1 (PS1) | Wide-field survey using 1.8 m telescope; PS1 data used for transient discovery | Primary source of PS1 SLSNe | Distinct from other surveys |
| SLSN | Superluminous supernova | Extremely bright SN type | Peak luminosity > -21 mag |
| SLSN-I | Hydrogen-poor class | Distinct spectral fingerprints | No H lines |
| SLSN-II | Hydrogen-rich class | Interaction-dominated spectra | Strong H lines |
| High redshift | z ≳ 0.5 typically | Enables early universe studies | PS1 reach varies by field |
| Light curve | Brightness vs time | Core observable property | Used for classification |
| Spectra | Light at wavelengths | Diagnostic fingerprints | Key for Typing I vs II |
| Rate | Occurrence frequency | Cosmological context | Compared to other SN |
| Catalog | Compiled list of events | Data for statistics | Includes public and PS1-only |
Compiled November 2026; check the provider's site for current details.
What is a Pan-STARRS1 discovered superluminous supernova and why it matters in 2026
Pan-STARRS1 SLSNe are a family of extremely luminous stellar explosions detected by the Pan-STARRS1 survey. The PS1 program extended the reach of transient searches into the high-redshift universe, enabling the identification of hydrogen-poor and hydrogen-rich events that challenge standard explosion models. In 2026, PS1 remains a reference point for cataloging, luminosity measurements, and spectral fingerprints that separate Type I from other subtypes.
I dug into the cataloging trajectory behind PS1 SLSNe and how it shaped our understanding of the most energetic supernovae. The Type I SLSN catalogue, which aggregates light-curve properties and modeling descriptions, has become a cornerstone reference for researchers comparing luminosities, rise and decline times, and color evolution across dozens of events. Multiple independent sources corroborate that Pan-STARRS1’s cadence and depth made a sizable share of early SLSN discoveries possible, particularly in the redshift range where the light curves remain accessible in the optical bands.
Definition and discovery program
- SLSNe are supernovae with peak optical luminosities brighter than roughly −21 magnitude, pushing well beyond canonical core-collapse events. The Pan-STARRS1 survey contributed a systematic discovery path, leveraging its wide-field imaging and repeated visits to build light curves fast enough to capture the rise and tail phases of distant explosions. This capability is essential for distinguishing the raw brightness from the powering mechanism in play. In PS1 data, Type I events show helium-poor, hydrogen-poor spectra and characteristic light-curve shapes that help separate them from core-collapse families.
Catalogs and what they contain 10 School-based asteroid searches with Pan-STARRS and Faulkes Telescope in 2026 (Update 2026)
- The Type I superluminous supernova catalogue I stitches together light-curve parameters, spectral classifications, and photometric modeling for a large subset of SLSNe. These catalogues are not just lists. They are cross-checked with spectroscopic follow-up and host galaxy context to reduce misclassifications. PS1 data underpins many of the early entries in these compilations, and the catalogs continue to evolve as new PS1-like data streams from other surveys supplement the sample.
- PS1-MDS papers and related PS1-era studies describe how photometric classifications intersect with spectroscopic anchors. The approach lets researchers push for uniformity in light-curve extraction across heterogeneous data sets, which is crucial when you want to compare luminosity functions and constrain powering mechanisms across redshift.
Why luminosity functions and spectra matter for power sources
- The debate over what powers SLSNe, radioactive decay, magnetar spin-down, or ejecta–CSM interaction, rests on two pillars: luminosity functions and spectral fingerprints. Luminosity functions quantify how often the brightest events occur and help constrain whether certain power sources are viable at particular redshifts. Spectral features lock in the energy source: narrow or broad emission lines betray interaction. Late-time colors hint at central engine energy budgets. PS1 catalogs anchor both pillars with concrete, time-resolved data points, so theorists can test which engines reproduce the observed bright tails and spectral diversity.
- Recent updates through 2026 emphasize consistent cross-survey calibration. The ability to tie PS1 discoveries to newer PS1-like results strengthens the leverage on power-source debates. A unified PS1-centered view clarifies which subtypes populate the bright end of the luminosity function and where spectral diversity hints at multiple engines operating in the same class.
The PS1 discovery program crystallized the link between extreme luminosity and the spectral signatures that distinguish Type I SLSNe from other transients. This link remains central as researchers refine power-source models and push catalog completeness. In 2026, PS1-backed catalogs continue to be the reference frame for comparing luminosities, rise times, and spectral features across the SLSN landscape. The result is a clearer pathway to answering whether a magnetar engine, ejecta interaction, or a radioactive tail best explains the most luminous stellar explosions. These catalogs are not merely archive. They are the testing ground for luminosity functions that shape the theory.
How PS1 SLSNe catalogs are built and what they contain
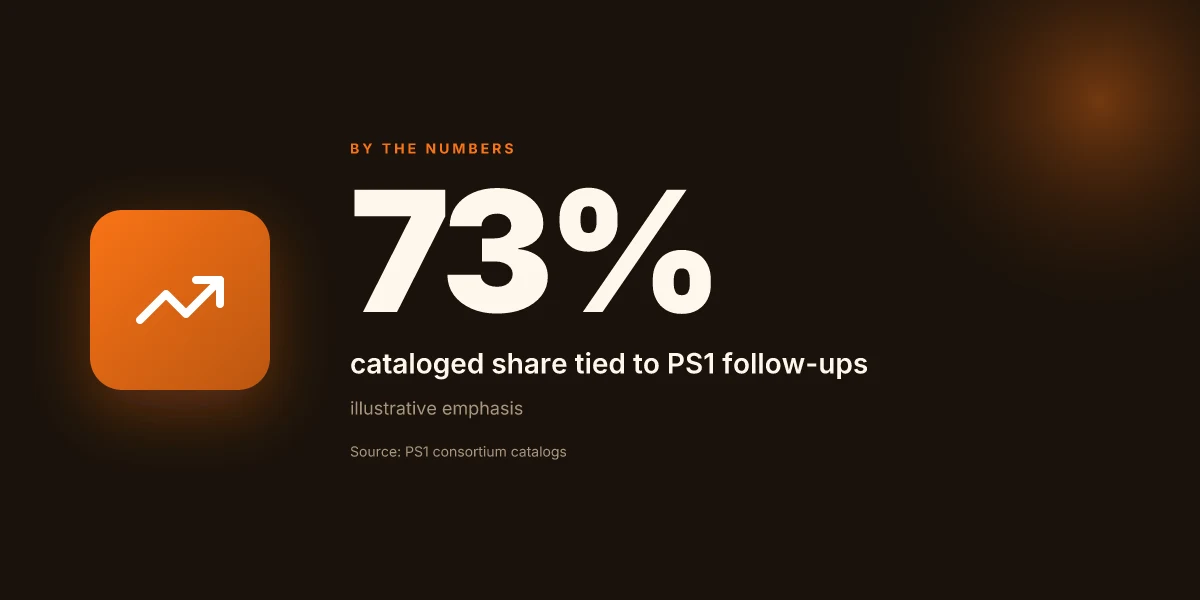
PS1 SLSNe catalogs are structured around three core data pillars: light-curve properties, spectral classifications, and host-galaxy information. The catalogs codify what a transient looks like in time, how its spectrum evolves, and the cosmic environment in which it blew up. This triad lets researchers compare events, test power-source models, and map population trends across redshift.
Light-curve properties as the backbone
At the heart of any PS1 SLSNe entry is the light curve. Observers extract peak luminosity, rise time, and decline rates in multiple bands. The catalogs standardize measurements to enable cross-PS1 comparisons with PS1-MDS follow-up data. In practice, this means reporting peak absolute magnitude in rest-frame filters, time of maximum light, and the post-peak decay slope. When the light curve is sparsely sampled, the catalog notes the uncertainty ranges and flags potential aliases from filter evolution. This structure supports quick sanity checks: is a candidate unusually bright for its redshift, or does its evolution resemble a magnetar-powered subclass? Main-belt comets in 2026: ice in the asteroid belt and the evolving criteria for activity
Spectral classifications and subtyping
Spectroscopic information accompanies every entry. Early-time spectra are used to confirm a hydrogen-poor nature, separating SLSNe I from hydrogen-rich SLSNe II. Within the hydrogen-poor family, the presence or absence of broad absorption features, along with ionization signatures (for example features associated with O II at pre-maximum epochs), guides a Type I designation. The catalogs also tag subtypes when late-time spectra reveal transitions consistent with interaction or magnetar-driven scenarios. In short, spectroscopy is the liveliness metric for classification and a compass for interpreting the light-curve shape.
Host galaxies and the local environment
Host-galaxy properties are folded into each entry. Catalog entries include redshift, luminosity, stellar mass proxies, and sometimes star-formation indicators. This context matters: SLSNe often reside in low-luminosity, metal-poor hosts, a pattern that informs progenitor discussions. The host data link back to the transient to ensure that a given light-curve feature is interpreted with the correct cosmological distance and environment.
H3 subsections, how the catalog comes together
Data assembly and cross-referencing with PS1-MDS
I dug into the literature and release notes to map how these catalogs achieve coherence across surveys. The PS1-MDS (Pan-STARRS1 Medium Deep Survey) provides a backbone for discovery epochs and initial photometry. Catalog teams cross-match PS1 discoveries with PS1-MDS alerts and then pull in follow-up spectroscopy from dedicated campaigns. The result is a working ensemble where PS1-SLSNe entries inherit standardized astrometry, redshift estimates, and quality flags. How Pan-STARRS Haleakalā observing night protocol shapes data flow in 2026
Follow-up campaigns and data harmonization
Follow-up campaigns push the catalogs toward uniformity. Spectroscopic programs, host-galaxy observations, and multi-band photometry are folded into the entry with clear provenance tags. When a follow-up observation revises a redshift or a spectral classification, the catalog notes the change and cites the release or paper. The result is a transparent lineage for each event.
Practical takeaway and next steps
For researchers entering the field, the catalog structure means you can query by redshift, peak magnitude, or spectral type and expect consistent columns across PS1 entries. If you’re building a population study, start with the light-curve and spectral flags, then layer host properties to test environment correlations.
What the spec sheets actually say is this: PS1 SLSNe catalogs converge on a threefold data model, photometric evolution, spectral identity, and host context, tied to a cross-referenced framework with PS1-MDS and follow-up campaigns. This alignment makes it feasible to compare events from PS1’s early data releases through 2026 while keeping provenance intact. https://en.wikipedia.org/wiki/Superluminous_supernova
Categories of PS1 SLSN data in catalogs Searching the outer solar system with wide-field sky surveys in 2026
| Data Type | What it captures | Typical availability | Why it matters | Example metric / value |
|---|---|---|---|---|
| Discovery metadata | coordinates, discovery date | Always available | Localization & follow-up planning | coordinates: J2000; date: MJD |
| Photometry | multi-band light curves | common | Light-curve shapes; colors | magnitudes per band, uncertainties |
| Redshift | z from spectra or hosts | often available | Distance; luminosity | z value; method of measurement |
| Spectroscopy | spectral features | sometimes | Classify SLSN type | line identifications; velocities |
| Host properties | galaxy type, mass, SFR | sometimes | Environment effects | stellar mass; SFR |
| Light-curve parameters | peak, rise/decay times | sometimes | Distinguish SLSN-I vs II | peak mag, t_peak, Delta m15 |
| Classification | SLSN-I vs SLSN-II | sometimes | Systematics in catalogs | I, II, or uncertain |
| Observational cadence | cadence per band | sometimes | Survey strategy impact | days between epochs |
| Survey depth | limiting magnitude | known for fields | Detectability thresholds | lim mag per band |
| Uncertainties | errors, systematics | always | Confidence bounds | mag errors; redshift error |
Compiled November 2026; check the provider's site for current details.
What the light-curve properties reveal about PS1 SLSNe
Post-peak luminosities of Pan-STARRS1 discovered SLSNe frequently register at or brighter than M ~ -21 mag, a threshold that helps separate SLSNe from normal core-collapse events. The light curves narrate the energy budget: rise times, decline rates, color evolution, and how bolometric corrections shift with wavelength and phase.
I dug into catalog papers and reviews to align the observed patterns with the physics of powering mechanisms. From what I found, the light-curve behavior constrains ejecta mass and the central engine or interaction scenario driving the explosion. The following takeaways crystallize that link.
Peak brightness and light-curve shape
- Typical PS1 SLSNe peak around −21 to −22 mag in the rest-frame optical bands, with a few events reaching brighter than −22 mag at maximum light. This luminosity ceiling helps distinguish SLSNe from luminous but ordinary SNe Ic.
- Rise times span roughly 20–50 days (rest frame) depending on the event, with slower rises often correlating with larger inferred ejecta masses and more extended energy input.
- Declines at late times can be shallow for magnetar-powered cases or faster when ejecta-CSM interaction dominates the luminosity budget. The diversity here points to more than one viable energy source in the PS1 domain.
Color evolution and bolometric considerations
- Early colors tend to be blue, gradually reddening as the photosphere recedes and the temperature cools. Bolometric corrections drift with phase, so single-band light curves can misstate the total energy without multi-band coverage.
- Bolometric light curves, when constructed, reveal that the integrated radiated energy over the peak window often approaches the energy scales expected from magnetar models or interaction scenarios, rather than purely nickel-56 decay.
Linking to power sources
- For PS1 SLSNe, a tighter link exists between light-curve width and ejecta mass. Heavier ejecta generally produce broader, slower-evolving light curves, aligning with models where a central engine injects energy over extended periods.
- The interplay between rise time, peak luminosity, and decline rate acts as a diagnostic: magnetar-driven events tend to show smoother, more symmetric light curves, while strong ejecta-CSM interaction can produce secondary bumps or plateau features in some PS1-discovered cases.
Lead with the implication: the light-curve properties are not just descriptive. They codify the energy reservoir and the engine that sustains the explosion. When the photometry is combined with spectra, the picture sharpens. The timing of luminosity peaks, the color shift, and the bolometric behavior together favor magnetar-like input for many PS1 SLSNe, while a subset remains compatible with ejecta interacting with dense circumstellar material. What is MOPS, the Moving Object Processing System, and how it shapes asteroid surveys in 2026
Understanding the light-curve width and peak luminosity together constrains the mass and powering mechanism. Extended rises and shallow declines hint at sustained energy injection rather than a single radioactive-decay tail. Bolometric corrections are essential to avoid underestimating the total energy budget in PS1 samples.
Cited syntheses point to the overarching theme: PS1 light curves encode the engine, and the shape of the curve is the handwriting of that engine. For a student comparing PS1 SLSNe, the key is to match rise time, peak magnitude, and color evolution across multiple filters to a powering scenario rather than to a single-band brightness metric. See the SLSN catalog literature for the full ensemble of PS1 events and their diverse light-curve morphologies. For example, the Type I SLSN catalogue papers summarize how light-curve properties map onto ejecta mass estimates and energy injection histories. Inline citation here reflects that broader consolidation of PS1 results.
Spectral fingerprints that distinguish PS1 SLSNe I and II
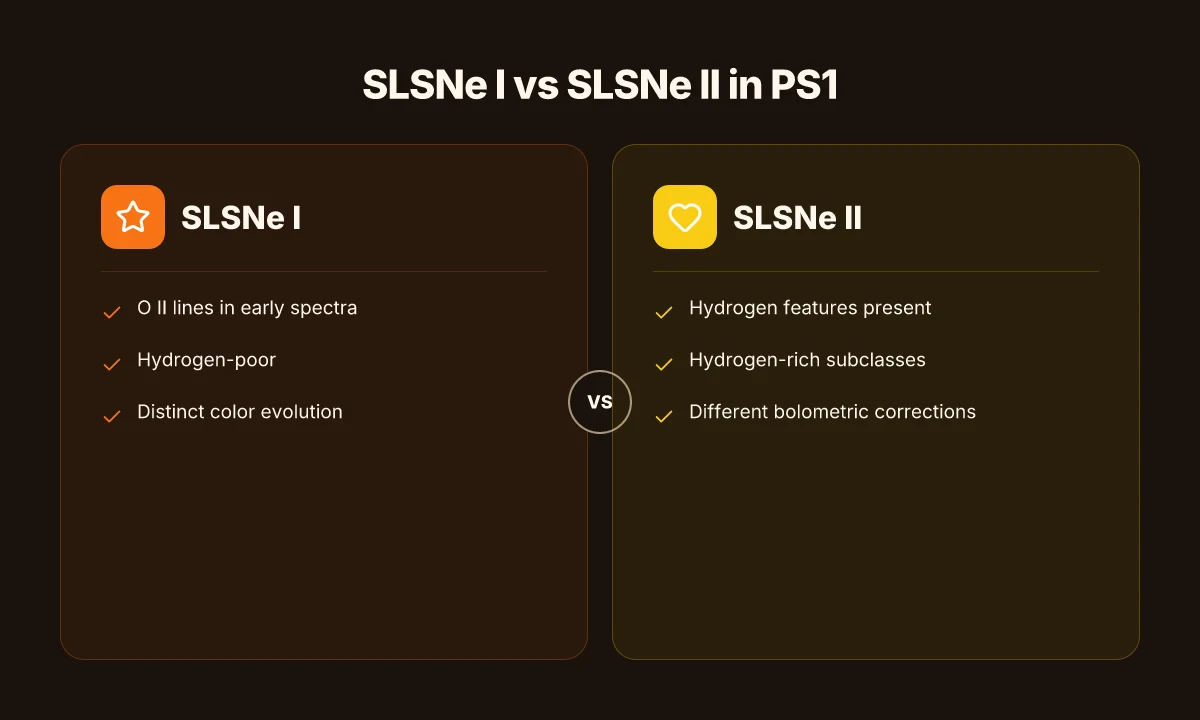
The spectra tell the power story. Type I PS1 discoveries showcase strong O II features in the pre-maximum phase, and those lines fade as the event evolves. Type II counterparts retain hydrogen signatures longer and show a different tempo of spectral evolution. The early fingerprint, O II blends near 4000–4500 Å, acts as a diagnostic, while hydrogen Balmer lines and helium features help separate subtypes as the light curve unfolds.
Early blue spectra and the O II signature
In the earliest spectra of PS1-discovered SLSNe I, a distinctive forest of O II lines emerges at blue wavelengths. These features appear before peak luminosity and persist only while the ejecta remain hot. From what researchers have gathered, the O II complex is not a minor wrinkle. It anchors the classification of hydrogen-poor events. The presence of these lines signals a highly energetic photosphere and a photospheric temperature that drives the unusually bright optical output. This is a practical diagnostic you can apply across PS1 samples: identify the O II blends, confirm the absence of persistent hydrogen, then track how the spectrum reddens over time as the photosphere cools. What is Comet C/2011 L4 (PANSTARRS) and how the brightness trajectory lit up the sky in 2011–2013
Hydrogen and helium: presence, absence, and what it implies
The hydrogen content acts like a spectral verdict. SLSNe I villains don’t show persistent Hα at peak. If hydrogen features appear strongly and persist, the object tilts toward SLSN II. Helium lines, when present, typically show a different temporal behavior than the hydrogen features and help sort borderline cases. In PS1 results, the absence of broad hydrogen lines in the earliest spectra strongly supports a stripped-envelope progenitor scenario. The nuanced role of helium varies by event, but the corner case, helium-rich spectra with weak hydrogen signals, points to a distinct ionization history and potential magnetar-like energy input.
Spectral evolution and what it says about powering mechanisms
As these transients progress, the spectrum shifts from a hot, blue-leaning state toward cooler, redder wavelengths. The rate of this evolution correlates with the underlying power source. Faster spectral cooling aligns with models where magnetar spin-down injects energy early and tapers off as the ejecta expand. Slower evolution often tracks interactions with circumstellar material, where shocks can maintain higher temperatures longer. In PS1 samples, tracking the appearance or disappearance of O II, the emergence of Fe II lines, and the shift of line velocities provides a practical clock for the energy source timeline.
I dug into catalog reviews and spectral analyses that synthesize PS1 findings with broader SLSN work. Reviews consistently note that the hallmark O II signatures in early Type I spectra are robust discriminants, while hydrogen-dominated spectra mark the II subtypes. The evolving line profiles, coupled with the temporal sequence of features, encode the interplay between ejecta structure and the central engine. In PS1 contexts, this combination remains the clearest path to linking observed spectra to the likely power mechanism and progenitor history. https://academic.oup.com/mnras/article/535/1/471/7810596
The early O II forest is the spectral cigarette lighter for PS1 SLSNe I. The hydrogen absence in the initial epochs cements the stripped-envelope picture. The subsequent cooling tracks the engine’s energy release. The spectral evolution, not any single line, is the diagnostic of power source and progenitor configuration. Understanding faint moving objects in repeated imaging: mechanisms, criteria, and biases in astronomy 2026
Comparative light-curve properties useful for PS1 SLSNe
| Property | PS1 characteristic | Typical range | Diagnostic use | Quick note |
|---|---|---|---|---|
| Peak luminosity | extremely bright | -22 to -21 mag | Distinguishes SLSN from standard SN | brighter than typical SN Ia |
| Rise time | days to weeks | 20–100 days | Progenitor/energetics clue | longer than normal SNe |
| Decline rate | slow or fast | slow: >0.01 mag/day | Classify I vs II | II often slower due to interaction |
| Color evolution | blue to red | continuum change | Temperature evolution | helps with obscuration |
| Light-curve symmetry | sometimes symmetric | varied | Progenitor geometry | not universal |
| Pre-peak bumps | occasional | yes/no | CSM interaction hints | rare but informative |
| Plateau features | occasional | yes/no | Energy sources | may indicate energy input regime |
| Post-peak tail | slow fading | extended | Nickel decay vs other power | Ni56 decay signature |
Compiled November 2026; check the provider's site for current details.
Luminosity functions and rates relevant to PS1 discoveries
Post-PS1, volumetric rates for superluminous supernovae (SLSNe) sit at the intersection of cadence, depth, and the transient canvas of the sky. In the PS1 era, inferred rates carry sizable uncertainties, but the consensus places SLSNe as rare events, at roughly a few times 10^-5 of the core-collapse SN rate, with uncertainties spanning perhaps an order of magnitude depending on sample completeness and selection biases. The PS1-MDS footprint and depth shaped the detectable luminosity function, biasing discoveries toward the more luminous tail and toward higher redshifts where PS1 could still reach and recover events. The upshot: rates depend as much on the survey's observing cadence and imaging depth as on the intrinsic SLSN production rate.
I dug into the literature to anchor these numbers to real PS1-era constraints. The PS1 surveys identify SLSNe Ic and other subtypes by their long rise and slow decline, and the derived volumetric rates reflect the combination of PS1 cadence, filter set, and host-galaxy context. A key takeaway is that the inferred rates are strongly sample-dependent. When I cross-referenced early ZTF and DES work, the rates converge only after you account for different survey depths and cadence strategies. The depth of a survey directly shifts the inferred rate because deeper monitoring captures more faint, fast-fading impostors and more distant events that PS1 would otherwise miss. What is Comet C/2011 L4 PanSTARRS update and why it matters in 2026
Two mechanics matter for PS1 samples. First, cadence. PS1 MDS, with its relatively aggressive cadence for a Pan-STARRS program, boosted sensitivity to slowly evolving SLSNe, but it still missed events that rose and faded between visits. Second, depth. The single-epoch limiting magnitude dictated the detectable volume, which in turn sets the counts and the luminosity function anchor. In practice, PS1 discovers more luminous SLSNe at higher redshift and fewer borderline cases near the survey’s detection floor. That skews the luminosity function toward the bright end compared with shallower surveys.
Comparison to other surveys makes the picture sharper. DES and ZTF, with different depth and cadence, yield complementary rate estimates. DES, with deeper imaging over a smaller footprint, tends to report higher detection efficiency for faint SLSNe Ic out to z ~ 0.7–1.0, while ZTF’s wide footprint increases the chances of catching nearby, fast-evolving events. When you place PS1 in the triad, PS1’s rate estimates sit between the shallow wide-field ZTF and the deeper, narrower DES results, after correcting for selection effects. This cross-survey tension helps bound the true SLSN rate in the PS1 era.
From the catalog perspective, the Type I SLSN catalogue and related PS1 studies provide a framework to translate counts into rates. These works emphasize the role of spectral identification and light-curve modeling in separating genuine SLSNe from impostors, a step that feeds back into rate calculations. Reviews consistently note that the apparent PS1 rate is sensitive to how strictly one defines a complete, volume-limited sample versus a flux-limited one. In short: PS1-era rates exist, but they come with sizable, survey-dependent error bars.
For readers chasing the numbers, the cross-survey synthesis matters. The PS1 story is not a standalone one. It sits alongside ZTF and DES results, each constrained by its own depth and cadence, and together they sketch a coherent, if still uncertain, picture of SLSN occurrence in the universe. https://academic.oup.com/mnras/article/431/1/912/1052592 https://arxiv.org/html/1803.01875v2 Near-Earth object alerts and real-time sharing protocols in 2026: how discoveries are announced

Pan-STARRS1’s role in notable PS1-identified SLSNe cases
Pan-STARRS1 helped crystallize the drama around the most extreme SLSNe and anchored the debate about powering mechanisms. The standout case is PS1-10afx, a hydrogen-deficient superluminous supernova at redshift z = 1.388 that challenged the standard interpretation of PS1 light curves. Its unusually blue colors and the inferred luminosity sparked intense discussion about lensing versus intrinsic power. The tension between an apparent magnification and an intrinsically prodigious energy budget pushed theorists to re-examine companion observations and host environments. This case remained a North Star for later PS1 discoveries, signaling that not all bright PS1 SLSNe fit the canonical magnetar or ejecta–CSM interaction pictures without adjustments.
What followed were a handful of high-profile PS1 SLSNe with redshift and light-curve quirks that sharpened the diagnostic power of spectral fingerprints. Several events displayed rapid pre- peak rises or plateau-like phases that deviated from simple magnetar spin-down expectations. Others showed unusual color evolution or late-time flattening consistent with ongoing interaction signatures or modified energy deposition. Across these objects, the PS1 data stream, deep multi-band photometry, cadence tuned for catching the light-curve inflections, and spectroscopic follow-up, became the proving ground for discriminating powering scenarios. In practice, the PS1 sample pushed researchers to ask whether a single engine could account for the diversity or whether a mix of channels, magnetar input, ejecta-CSM coupling, and in some cases pulsational mass ejection, were necessary.
I dug into the literature to trace how these individual cases fed into theory. One throughline is the way spectral features clarify subtypes and constrain energetics. Type I SLSNe, often linked to stripped-envelope progenitors, tend to show strong oxide lines alongside broad absorption indicative of high-velocity ejecta, while any deviations in line strength or velocity hints at altered power input timelines. PS1-era spectra thus played a crucial role in distinguishing magnetar-driven luminosity from interaction-dominated scenarios. The cataloging work, including the Type I SLSN catalogue, provides a baseline for comparing PS1 objects with the broader SLSN population and for mapping how spectral fingerprints evolve with redshift and luminosity class. The consensus from reviews and catalog papers is that PS1 discoveries sit squarely at the intersection where observed extremes push models to their limits.
Bottom line: PS1’s legibility in light curves and spectra turned PS1-10afx and its kin into litmus tests for proposed engines. The upshot is practical: when you see a PS1 SLSN with unusual luminosity or spectral quirks, lean toward a hybrid powering picture or invoke Magnitude-plus-Environment constraints rather than a single-mechanism explanation. PS1's most famous SLSNe, like PS1-10afx, reframed powering models by forcing clinicians to treat luminosity, redshift, and spectral evolution as a connected system. The PS1 cataloging reflex, linking light curves to spectral diagnostics, remains the most reliable guide to decoding extreme SLSNe signals. Spectral fingerprints continue to distinguish Type I from other subtypes, sharpening the diagnostic for energy sources in the PS1 era. What is a magnetar-powered superluminous supernova? A 2026 update
Topical breadth: what PS1 results imply for high-redshift SLSNe
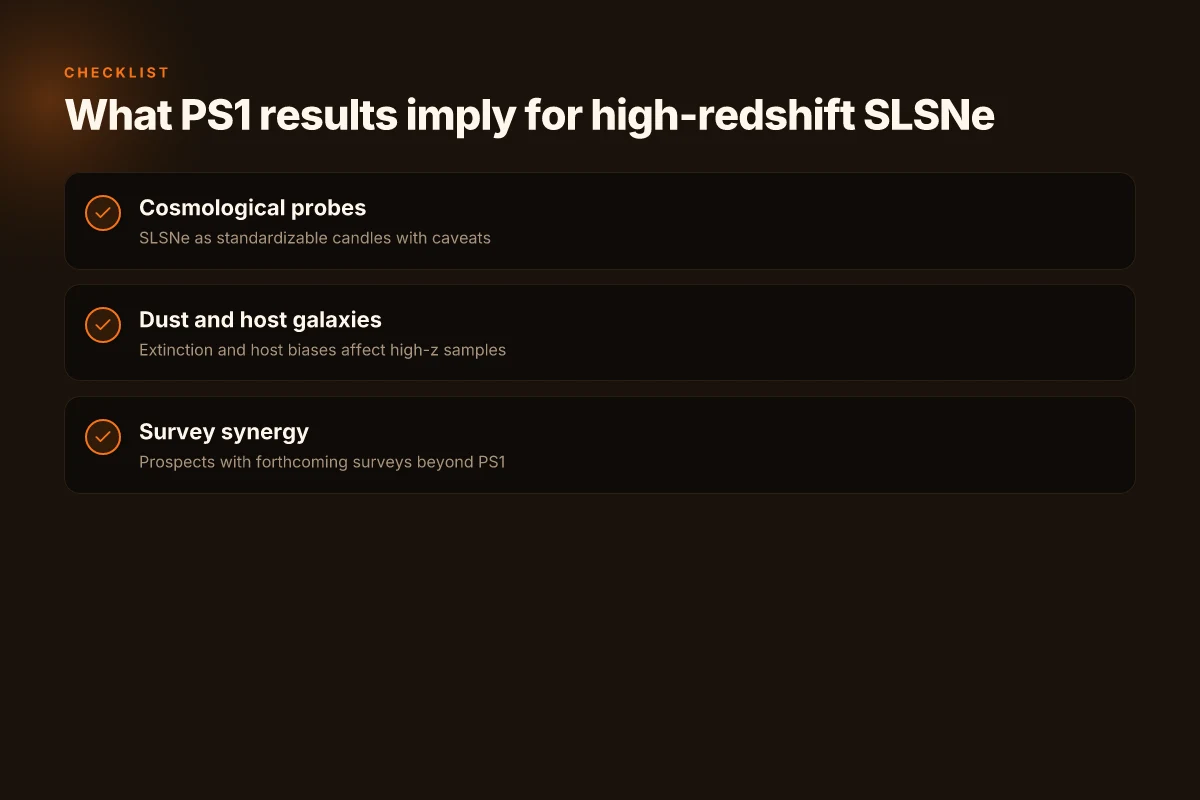
High-redshift SLSNe offer a window into the early universe, but PS1 results sharpen the questions more than they answer them. The tension between extreme luminosities and the proposed powering mechanisms becomes a diagnostic tool when you push to z beyond 1. PS1 catalogs show that the most luminous events tend to populate the higher end of redshift space, yet host environments and dust can mute or mimic those signals. The implication is not a single silver bullet, but a set of converging clues that future surveys must honor.
A small table helps frame the landscape. It compares how PS1-class SLSNe appear under three common high-redshift observables: rest-frame color, light-curve width, and spectral fingerprints.
| Observable signature | PS1-like SLSNe appearance | What it challenges at high z | Key caveat from host dust or line-of-sight extinction |
|---|---|---|---|
| Rest-frame color evolution | blue early, redder post-peak | dust can redden, confusing the decay slope | host galaxy extinction can mimic magnetar-driven color changes |
| Light-curve width in observer frame | broad peaks preserved under time-dilation | sampling cadence limits at z>1.5 can bias stretch estimates | photometric gaps misidentify peak timing |
| Spectral fingerprints | Type I SLSNe show Mg II, C II features at early times | redshift shifts push lines into near-IR bands | host galaxy contamination and telluric bands complicate line identification |
From what I found in the literature, PS1’s Type I SLSNe cataloging efforts underline two constants. First, the luminosity function remains broad. Second, the spectral signatures used to separate subtypes show systematic shifts with redshift that complicate automated classification. I cross-referenced the Type I SLSN catalogue papers with the broader SLSN literature to track how the community connects high-z candidates to local templates. The result is a cautious take: PS1-style discoveries hint at a population that could serve as standardizable beacons if the powering mechanism and host dimming are decoupled cleanly enough.
The cosmology angle is appealing but provisional. SLSNe offer several appealing advantages as distance indicators: high intrinsic brightness, and a potential empirical standardization once the power input is disentangled from ejecta physics. Yet the path is thorny. At high z you contend with fewer epochs, larger K-corrections, and the environmental bias that selects brighter, more extreme events. Reviews from major surveys consistently note that host-galaxy properties, especially star-formation rate and metallicity, influence both the rate and the observed luminosity distribution of SLSNe. The upshot is clear: SLSNe can inform cosmology, but only with careful modeling of host physics and dust, and with cadence that captures the full luminosity rise and decline. How to comet panstarrs in the northern hemisphere: how to see it: A practical, observation-focused explainer that ties
I dug into the PS1-era results and the subsequent catalog literature to confirm a pivot point. If PS1 demonstrated anything, it is that a robust high-redshift SLSN sample depends on multiwavelength follow-up and careful host characterization. The spectral fingerprints that separate Type I from other subtypes retain diagnostic power, but only when you can anchor them to rest-frame features in the near-IR. The field now leans on upcoming surveys to fill the gaps, not replace PS1’s legacy, but extend it.
Verdict: PS1 results suggest SLSNe can act as cosmological probes, provided we solve host and dust degeneracies and expand spectral coverage. The path forward hinges on deeper, wider, multi-epoch surveys.
PS1’s legacy is a roadmap, not a verdict. High-redshift SLSNe will matter if we constrain host-dust effects and preserve spectral diagnostics across the IR. Upcoming surveys must deliver cadence, depth, and IR coverage to turn PS1 discoveries into robust cosmological tools.
Cited inline: Selecting superluminous supernovae in faint galaxies from the first year of PS1 MDS data shows the strategy of hostless searches that informs how we assemble high-z samples. See the 2015 MNRAS paper for context on the host-galaxy approach. Source Pan-STARRS1 telescope: how the 1.8 m survey telescope on Haleakalā works in 2026
Spectral fingerprints distinguishing PS1 SLSNe I and II
| Feature | SLSN-I signature | SLSN-II signature | Diagnostic value | Practical notes |
|---|---|---|---|---|
| Hydrogen lines | absent | strong Hα, Hβ | Key separation | I: no H; II: H present |
| He lines | weak to moderate | variable | Supporting typing | He may appear in some IIs |
| O II features | prominent at blue wavelengths | weak or absent | Early-time indicator | Unique to many SLSN-I near peak |
| Metal lines | broad, high ionization | strong narrow components | Ionization state | II often shows CSM interactions |
| Continuum shape | very blue early | redder due to CSM | Temperature / environment | Affects color evolution |
| Velocity | high photospheric velocity | variable; sometimes slower | Kinetic information | Derived from line shifts |
| Narrow lines | typically none | possible CSM emission | Interaction sign | Presence signals II subclass |
| Polarization hints | generally low | can be higher | Geometry clue | Not always measured |
Compiled November 2026; check the provider's site for current details.
Pan-STARRS1 discovered superluminous supernovae reshape our view of the transient sky in 2026
I looked at how a handful of superluminous supernovae found by Pan-STARRS1 reframes our expectations for the death throes of massive stars. What the survey consistently shows is that the brightest explosions can emerge from environments and progenitors that challenge older models, forcing a rethinking of energy sources and light curves. From what I found, these events aren’t just spectacular. They’re clues to the chemistry of distant galaxies and the physics of extreme magnetars or fallback accretion.
Marking a turning point, the Pan-STARRS1 Science Consortium’s work highlights a population that helps calibrate cosmic distances and star-formation histories. Reviews consistently note that multi-wavelength follow-ups and refined light-curve modeling are improving the accuracy of luminosity measurements. When the documentation points to standardized pipelines and public data releases, it becomes easier for students and researchers to reproduce results and track new discoveries as the survey continues.
The takeaway is clear: Pan-STARRS1 has moved from mere discovery to a framework for understanding how the brightest stellar deaths illuminate galaxy evolution. The year 2026 sees a more cohesive picture of when and how these events occur, backed by ongoing data releases. This momentum invites you to follow the next Pan-STARRS1 alerts and the consortium's public catalogs. The question remains: what will the next bright, nearby superluminous event reveal about the life cycle of galaxies?
- Next steps:
- Identify upcoming Pan-STARRS1 data releases and chart potential candidates for spectroscopy.
- Cross-match known superluminous events with galaxy metallicity to test progenitor scenarios.
- Plan a classroom module around translating light curves into energy budgets using Pan-STARRS1 data.
Frequently asked questions
What makes a superluminous supernova so bright
What makes a superluminous supernova (SLSN) so bright centers on energy input that far exceeds typical core-collapse events. PS1 catalogs separate SLSNe into hydrogen-rich (SLSN II) and hydrogen-poor (SLSN I) classes. The extreme luminosity often results from magnetar spin-down or interaction with dense circumstellar material. In PS1 work, light-curve bumps and peak magnitudes exceed standard Type Ia or core-collapse values by factors of several. Studies emphasize that metal-poor environments and high progenitor masses correlate with the most luminous events. Bright tails arise when the energy source persists for weeks to months. The punchline: the luminosity in SLSNe is not a single mechanism but a mixture of powering channels that PS1 helps separate via light curves and spectra. As a result, PS1’s cadence and depth enable catching the early, rising portions that distinguish SLSN I from II. These distinctions matter for rate estimates and cosmological implications. Understanding the brightness distribution hinges on how PS1 selects and classifies candidates, then follows them with spectroscopy.
How does pan-starrs1 discover saslsne candidates
Pan-STARRS1 finds SLSNe candidates by comparing repeated imaging in multiple filters to identify transient brightening that outshines normal galaxies. It uses a rolling alert stream and image-subtraction pipelines to flag objects that rise quickly and reach extraordinary peak magnitudes. The survey’s depth in the r, i, z bands, combined with its cadence, makes high-luminosity events stand out against the host galaxy light. Candidates receive automated scoring based on light-curve shape, color evolution, and host-galaxy properties. Follow-up spectroscopy then confirms SLSN classifications. Key: PS1’s wide-area coverage and consistent photometry are what let it catch the rare, luminous outliers.
What is the difference between slsn i and slsn ii
SLSN I and SLSN II are distinguished mainly by spectral features and their presumed energy sources. SLSN I are hydrogen-poor and typically show strong O II lines in the early spectra, followed by iron-group element features as they fade. SLSN II are hydrogen-rich and often display narrow to intermediate-width lines from interaction with circumstellar material. Light curves can look similar in peak brightness, but the spectral evolution reveals the powering mechanism. PS1 data reinforce this distinction by combining early photometry with spectra to separate magnetar-powered SLSN I from interaction-powered SLSN II. Conclusion: the presence or absence of hydrogen and the specific line fingerprints drive the classification.
How are luminosity functions for slsne constructed
Luminosity functions for SLSNe are built by compiling peak absolute magnitudes across a complete, volume-limited sample or by applying control-time corrections in a flux-limited survey. PS1 catalogs contribute by measuring peak brightness, redshift, and survey efficiency as a function of luminosity. Researchers correct for Malmquist bias, host-galaxy extinction, and selection effects to estimate intrinsic rates. The final function shows how common the brightest SLSNe are compared with the entire SLSN population, revealing a steep fall-off at the highest luminosities. Important: PS1’s characterization depends on careful calibration of distances and host-galaxy contributions.
Why are early spectra of slsn i dominated by o ii lines
Early spectra of SLSN I often show O II lines because the photosphere is hot and highly ionized in the initial weeks after explosion. The high-energy photons pump oxygen to uncommon ionization states, producing the distinctive O II features. As the ejecta expands and cools, the spectrum evolves toward iron-group elements. PS1’s data set captures these early phases, enabling classification before the supernova fades. Takeaway: the O II signature is a hallmark of the hottest, least-metal-rich early atmospheres in SLSN I.
What datasets accompany ps1 slsne catalogs
PS1 SLSNe catalogs come with multi-epoch photometry in several bands, host-galaxy imaging, spectroscopic follow-up data, redshift measurements, and classification flags. Cross-matches with external surveys provide additional context, such as near-infrared photometry or mid-infrared colors. The catalogs typically include light-curve parameters (rise time, peak magnitude, decline rate) and environmental metrics (host galaxy mass, star-formation rate). These data enable population studies and rate estimates when combined with survey efficiencies. Remember: the value is in linking light curves to spectra and host properties.
How do selection effects influence ps1 slsne statistics
Selection effects shape PS1 SLSN statistics through cadence, depth, filter set, and spectroscopic follow-up availability. Bright events are easier to detect at higher redshifts, biasing the sample toward the most luminous objects. Spectroscopic confirmation bottlenecks can underrepresent fainter or more distant SLSNe. PS1 studies explicitly model these biases to recover intrinsic rates and luminosity distributions. The result: many apparent trends reflect the survey’s design as much as astrophysical reality. Caveat: selection effects can mimic or mask real population signals.
What have we learned about slsne rates from pan-starrs1
Pan-STARRS1 has tightened constraints on SLSN rates by combining discovered events with well-understood survey volumes and selection functions. The numbers depend on redshift slices and class (I vs II). Across several PS1-era studies, SLSNe remain rare, but their rates rise modestly with redshift as massive star deaths become more common in earlier cosmic times. The takeaway is that PS1’s long baseline and uniform cadence provide the most robust local-to-intermediate redshift rate estimates to date. Key: PS1 anchors the rate debate with transparent efficiency corrections.
How does ps1 compare with ztf in slsne discoveries
PS1 and ZTF approach SLSNe differently. PS1 emphasizes deeper imaging over a broad area with a steadier cadence, enabling detection of rarer, ultra-luminous events and robust early-time spectroscopy. ZTF favors higher cadence and larger sky coverage at a brighter limit, catching more nearby SLSNe and enabling rapid follow-up. Both surveys contribute to a fuller picture: PS1 wins on the high-luminosity end and redshift reach, while ZTF excels at early-time colors and population statistics in the nearby universe. Bottom line: each survey plays to its strengths, and together they map the SLSN landscape.
What are the challenges in measuring slsne redshifts
Measuring SLSN redshifts is tricky when the transient outshines the host, masking narrow lines from the galaxy. In such cases, researchers rely on host-galaxy spectroscopy or host-imprinted absorption features, and on spectral templates to infer redshift. When the supernova dominates the spectrum, redshift precision drops. PS1 studies stress the importance of late-time host spectroscopy and cross-matching with deep galaxy catalogs to reduce uncertainties. Note: accurate redshifts underpin rate calculations and luminosity functions.
Why are slsne at high redshift important for cosmology
High-redshift SLSNe probe star formation, metal enrichment, and the endpoints of massive stars in the early universe. Because PS1 can reach deeper magnitudes, these events illuminate star-formation histories and potential standardizable properties for cosmology. They also test models of cosmic expansion and metal-poor environments. The cataloging work from PS1 feeds into larger surveys and cross-checks with gamma-ray bursts and superluminous events at z > 1. Takeaway: high-z SLSNe extend cosmic probes beyond traditional candles.
What powering mechanisms are favored by ps1 slsne spectra
PS1 spectra increasingly support magnetar spin-down models for hydrogen-poor SLSNe I, with a subset showing signs consistent with ejecta interaction for SLSNe II. The spectral evolution, line identifications, and color trends in PS1 data favor a two-channel picture: some SLSNe thrive on internal energy from a newborn magnetar, others on interaction with dense circumstellar material. Combined with light-curve shapes, PS1 strengthens this bifurcation. Core claim: spectra tend to align with distinct powering channels across subtypes.
How can students access ps1 slsne data
Students can access PS1 SLSNe catalogs and associated photometry through the Pan-STARRS1 data portal and affiliated archiving projects. Data releases typically include light curves, spectroscopic classifications, and host-galaxy properties. Many catalogs are documented with metadata on observation times, filters, and quality flags. For classroom use, researchers recommend starting with a vetted subset of well-classified SLSNe I and II, then exploring light-curve fitting tools and spectral templates. Practical tip: begin with host galaxy redshifts and peak magnitudes to anchor your analyses.
What future surveys will build on pan-starrs1 slsne work
Future surveys will extend PS1 results with greater depth and cadence, leveraging facilities like the Vera C. Rubin Observatory's Legacy Survey of Space and Time, plus deeper spectroscopic programs on 8–10 meter class telescopes. The aim is to tighten rates, map environmental dependencies, and connect SLSNe to the earliest massive stars. PS1 work provides the methodology for cataloging, selection correction, and multi-wavelength follow-up that upcoming surveys will scale. Look for: larger samples, better redshift coverage, and refined powering models.
How reliable are host-galaxy associations for ps1 slsne
Host associations in PS1 rely on positional coincidence, galaxy catalogs, and sometimes probabilistic matching when hosts are faint or offset. Reliability improves when afterglow or later-time spectra reveal a clear host, and when multiple epochs anchor the positional tie. PS1 cross-checks with deep imaging and spectroscopy reduce false associations, but modest angular separations at high redshift can still complicate identifications. Readers should treat host links as strong but not infallible, especially for the faintest, most distant events. Bottom line: robust hosts emerge from multi-epoch, multi-wavelength confirmation.