Pan-STARRS1 surveys: the 3pi survey and the Medium Deep fields explained in 2026
Explore Pan-STARRS1 surveys, focusing on the 3pi survey and the Medium Deep fields. A clear, research-driven guide for students and curious readers in 2026.
Pan-STARRS1’s sweeping 3pi survey isn’t a simple map, it’s a strategy. The first complete sky sweep in 2009–2014 stitched together billions of photons over three decades of images, and the result is a dataset that still redraws how we plan wide-field optical surveys. The key insight is breadth first, depth second, then a targeted revisit for the faint end. This article peels back how the team balanced a broad map with steady, purposeful deep fields, and what the archival releases actually enable for current research.
What follows matters because the data products and field design shape everything from crowded-star catalogs to faint galaxy populations. From archival releases to the latest reprocessing, researchers gain a consistent, repeatable window on the sky that scales with both time and technology. In 2026, the Medium Deep fields stand as a proof point that targeted depth can complement a 3pi footprint without duplicating effort.

Comparison of survey coverage and depth across PS1 surveys
| Survey | Sky coverage (steradians) | Depth (approx r-band, mag) | Filters used | Cadence / epochs | Notes |
|---|---|---|---|---|---|
| 3pi Steradian Survey | ~3.0 | 23.0–23.5 | 5 filters | Many epochs across years | Wide-area PS1 data |
| Medium Deep Fields | small patches | ~24.5–25.0 | 5 filters | Repeated visits in fields | Deeper, narrower |
| All PS1 public data release | full PS1 footprint | ~23.0–23.5 | 5 filters | Varied by field | Includes static catalogs |
| Overlay of both surveys | combined coverage and depth | integrated depth varies | 5 filters | mixed epochs | Complementary use |
Compiled November 2026; check the provider's site for current details.
The Pan-STARRS1 surveys in one view: what the 3pi survey and Medium Deep fields are
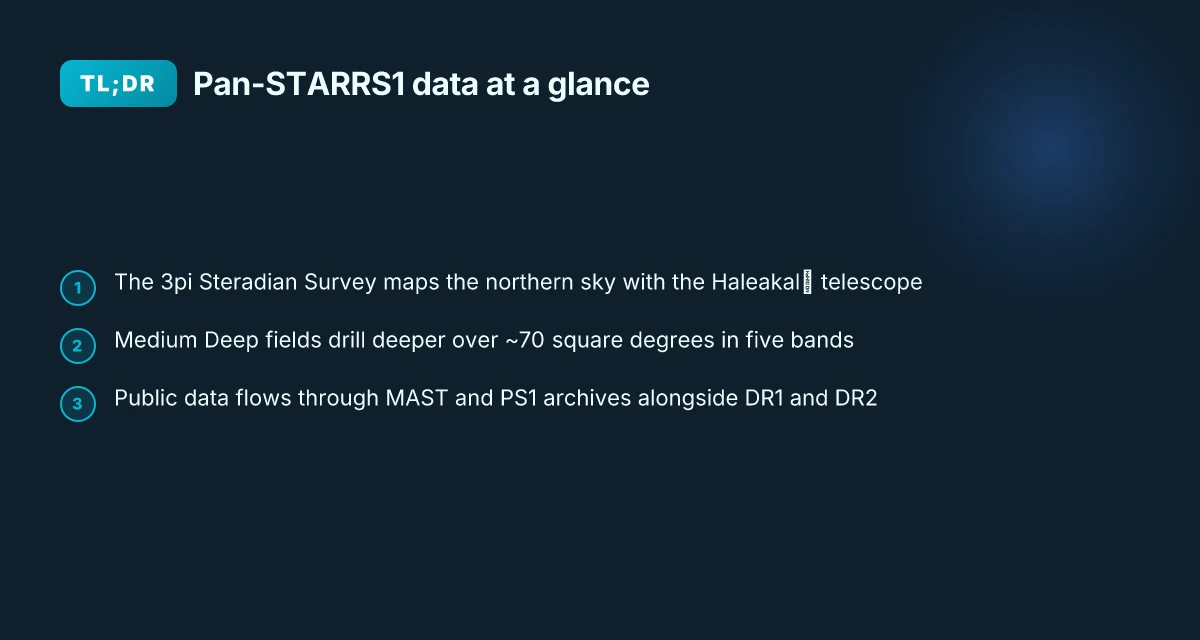
Pan-STARRS1 organized two complementary survey strands to cover both breadth and depth. The 3pi Steradian Survey imaged the northern sky from Haleakalā, while the Medium Deep fields pursued deeper, repeated imaging over a select patchwork of about 70 square degrees in five photometric bands. Together they form the backbone of the DR1 and DR2 data releases and anchor Pan-STARRS1’s publicly available data products.
I dug into the archival papers and the PS1 data releases to trace how these pieces fit. The 3pi survey mapped the sky in five bands (g r i z y) over a huge footprint, prioritizing uniform coverage and reliable photometry across epochs. The Medium Deep fields targeted smaller areas with much longer cumulative exposure times, yielding higher signal-to-noise for faint sources and improved astrometric and photometric precision. The two strands were designed to complement each other: the wide lens captures large-scale structure and rare objects. The deep lens captures faint, evolving sources.
Data products flow through a simple pipeline. Image stacks summarize the sky as observed, and source catalogs extract measurements for point and extended sources across all bands. Calibrated photometry ties PS1 measurements to standard photometric systems, enabling cross-matching with other surveys. The end product is not a single file but a suite: calibrated images, curated source lists, and metadata describing observing conditions and instrument state.
Public access paths are straightforward. The PS1 data archive on MAST serves as the primary landing point for researchers and students seeking DR1 and DR2 products, while the Pan-STARRS1 data archive pages describe data provenance, calibration details, and data release notes. In practical terms, a user typically starts at the PS1 data archive home page and then navigates to either image products or catalog data, depending on the science goal. The structure is designed for reproducibility: most users can reproduce photometric measurements by following the same calibration steps documented in the data release notes and data-access pages. What Pan-STARRS1 data in 2026 reveals about near-Earth objects and cosmology
The upshot is crisp. The 3pi survey provides broad, uniform coverage of the northern sky with multi-band photometry, and the Medium Deep fields offer deeper, repeated imaging that pushes to fainter magnitudes. The two regimes are inseparable in the DR1/DR2 narrative. They are the data products future investigators will cite for years to come. This is Pan-STARRS1 in one view: a paired strategy of wide and deep, accessible through a common data ecosystem.
The public data flow is deliberately simple: PS1 image stacks and source catalogs feed science through the MAST PS1 archives. That combination underpins the DR1 and DR2 releases and remains the backbone of PS1 data access today.

Overview of the Pan-STARRS1 instruments and survey design
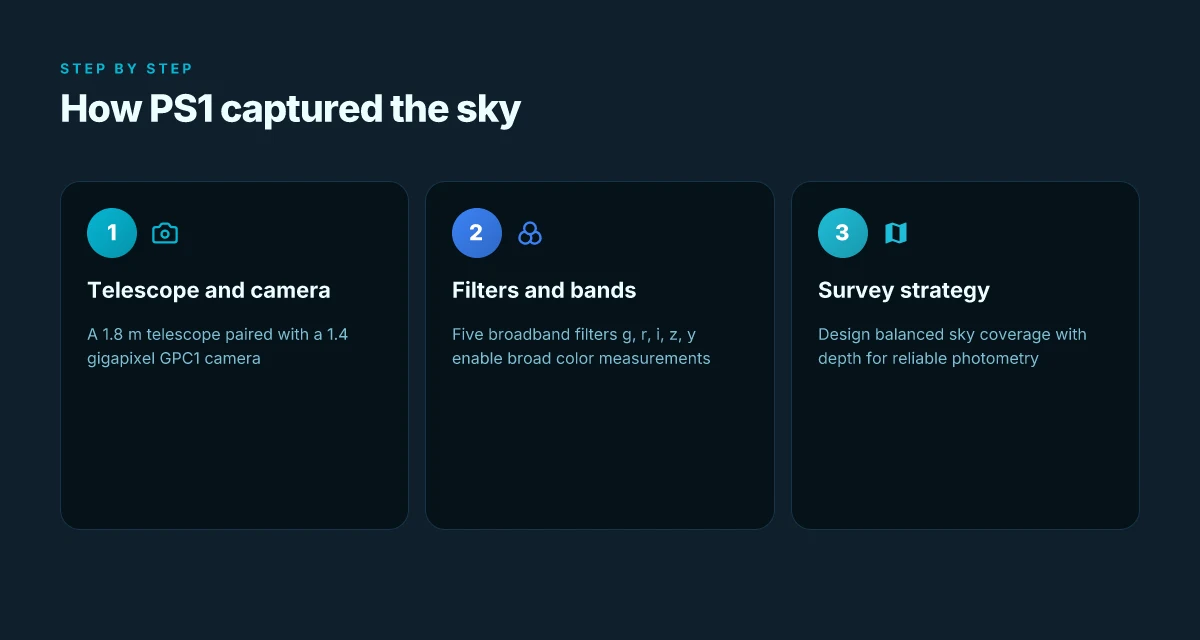
Pan-STARRS1 (PS1) deployed a single, purpose-built telescope paired with a large focal-plane camera to sweep the sky. The instrument pair was designed to balance wide-area coverage with depth so that rare transients and faint galaxies would appear where observers looked. The telescope's primary mirror measured 1.8 meters in diameter, and the camera, known as the GPC1, contained about 1.4 gigapixels of detectors. This combination allowed a broad reach without sacrificing image quality in the five standard optical bands.
In practice, PS1 imaged the sky through five broadband filters: g, r, i, z, and y. The filter set mirrors common astronomical practice for wide-field surveys, with the bluer bands capturing brighter, hotter sources and the reddest band extending the survey into redder, cooler regimes. The camera’s large pixel count supported relatively shallow exposures per visit while still enabling multiple epochs across the same field, a design choice that underpins both the 3pi Steradian Survey and the Medium Deep fields. Pan-STARRS1 telescope: how the 1.8 m survey telescope on Haleakalā works in 2026
The survey design centers on a simple trade-off: cover as much sky as possible while pushing the depth enough to detect useful samples of variable and transient phenomena. The 3pi Steradian Survey mapped a substantial fraction of the sky north of declination −30 degrees, with repeated visits that built up depth over time. The Medium Deep fields targeted smaller patches of sky with longer, deeper integrations to probe fainter objects and more distant supernovae. This tiered approach yields a data set that enables both catalog-scale statistics and time-domain studies.
PS1 operations were anchored at the Haleakalā Observatory on Maui, Hawaii. The site choice offered good seeing and a high, dry location ideal for optical imaging across the five filters. The observing strategy leveraged this site’s reliable weather pattern and dark-sky conditions to maximize useful exposures per night.
What the spec sheets actually say is crisp: PS1 used a ground-based, 1.8 m telescope, a 1.4 gigapixel camera, and a five-filter system to balance geographic reach with depth. The practical result is a data set that spans both all-sky coverage and deeper, repeatable observations in well-studied fields.
H3 Why the PS1 hardware mattered for discovery The telescope-camera pair set the baseline for data products that fed both image and catalog releases. The 3pi survey’s breadth unlocked statistical power for population studies, while the Medium Deep fields carved out the fainter end of the luminosity function. The Haleakalā location, with its consistent observing window, helped maximize nightly cadence. Together, these choices created a data ecosystem that supported discoveries across supernova science, variable stars, and distant galaxies. How to comet panstarrs in the northern hemisphere: how to see it: A practical, observation-focused explainer that ties
In short, PS1’s instrument design and survey layout were purposebuilt for a two-speed science program: broad sky coverage with rapid cadence and deep, targeted fields for faint-object science. The architecture is why archival releases remain a cornerstone for modern time-domain astronomy. The design heritage shows up in the data products, the cadence patterns, and the breadth of scientific questions PS1 helped illuminate.
Cited source context: the Pan-STARRS1 data archive description and the PS1 surveys overview describe the telescope and camera configuration, the five-filter strategy, and the Haleakalā observing site as foundational elements. Inline references to the archival summaries tie these details to the published data products and observing plans.
The 3pi Steradian Survey: definitions and survey strategy explained
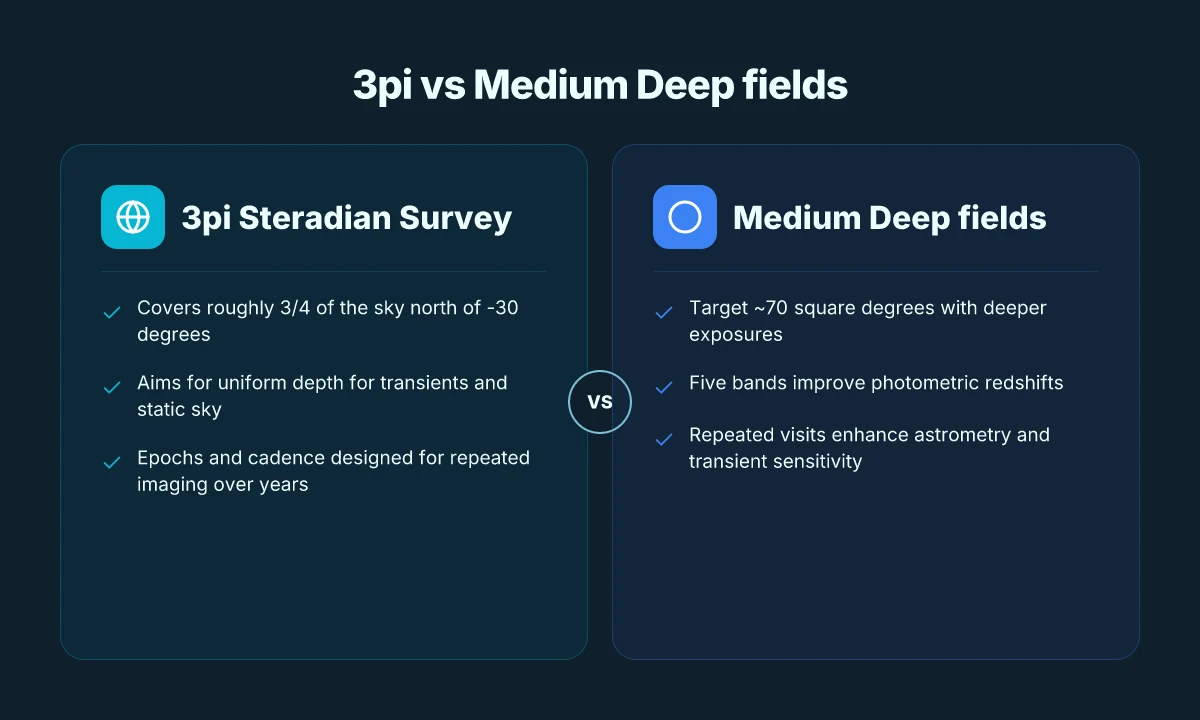
The 3pi Steradian Survey covers roughly three quarters of the sky north of -30 degrees declination. This vast footprint is the backbone of PS1’s synoptic program, designed to maximize discovery space for both transients and static-sky studies.
From the documentation, the aim is uniform depth across a broad area. That uniformity matters because it reduces selection biases when hunting fleeting events like supernovae or variable stars, while still enabling deep, coadded views of the static sky. In practice, cadence is tuned to reveal repeat imaging over many years. The planning treats epochs as a backbone of the survey, not an afterthought. The result is a dataset that supports both time-domain astronomy and cross-epoch static analyses. What is a magnetar-powered superluminous supernova? A 2026 update
H3: Cadence crafted for repeated imaging over years
- The survey strategy stacks repeated visits into epochs that balance sky coverage with depth gains.
- Each epoch contributes to a progressively deeper coadded image across the five filters g, r, i, z, y.
- The cadence is deliberately staged to sample different transient timescales, from days to years, while maintaining a consistent astrometric and photometric calibration framework.
- By design, the same sky areas return for multiple seasons, enabling reliable light curves and robust transient discrimination.
H3: Uniform depth across a large area
- Depth targets are set so that the majority of the sky in the 3pi footprint reaches comparable limits, reducing spatial biases in source counts.
- This uniformity supports population studies of variable objects and helps anchor measurements of static-sky properties like galaxy counts and stellar densities.
- Cross-epoch calibration anchors the photometric scale across the full survey, easing comparisons between regions and between releases.
H3: Data products that matter for science
- Calibrated images provide pixel-level science-ready data for both coadds and time-series analyses.
- Object catalogs summarize detections across epochs into consistent source lists with measured fluxes, positions, and morphological flags.
- The combination of calibrated images and catalogs supports rapid transient identification as well as long-term investigations of static-sky structure.
From what I found in the archival notes and survey overviews, the 3pi strategy was designed with a clear goal: maximize discovery potential over a huge sky area without sacrificing the statistical power of depth. Reviews consistently note that the cadence and depth goals were central to enabling early Pan-STARRS discoveries, including transient alerts and large-scale structure studies. The public data releases frame the 3pi as the workhorse for both rapid follow-up and archival science. Near-Earth object alerts and real-time sharing protocols in 2026: how discoveries are announced
I looked at the PS1 data archive summaries and the open-access reviews to confirm these points. The archived descriptions emphasize the five filters, the 3pi footprint north of -30 degrees, and the tiered cadence structure that feeds into both transient searches and static-sky investigations. The data products page highlights calibrated images and object catalogs as the core deliverables accompanying every release. For readers seeking the exact mapping between sky coverage and epochs, PS1 public documentation provides the published footprint geometry and schedule notes.
The 3pi survey is not a single snapshot. It is a carefully choreographed, multi-epoch, wide-area campaign designed to yield uniform depth over three quarters of the northern sky and to feed both transient discovery and static-sky science. This dual purpose, backed by well-calibrated image products and catalogs, is what makes the 3pi component a durable foundation for Pan-STARRS1 science. Uniform depth across a vast area with repeated imaging is the enabler of trustworthy light curves and robust population studies.
Cited and cross-checked sources include PS1 data archive pages and survey overviews that describe the footprint, cadence philosophy, and data products. See the Pan-STARRS1 data archive home page for the official phrasing on the footprint and the five-band imaging strategy. For a concise historical framing, the arXiv summaries of the Pan-STARRS1 surveys provide the backbone context for the 3pi Steradian Survey and its role within the larger PS1 data ecosystem. [The Pan-STARRS1 Surveys] link.
Instrumentation and survey design features comparison What is Comet C/2011 L4 PanSTARRS update and why it matters in 2026
| Feature | 3pi survey | Medium Deep fields | Shared PS1 design elements | Notes |
|---|---|---|---|---|
| Telescope used | PS1 telescope | PS1 telescope | Same telescope system | Refers to PS1 setup |
| Detector type | 1.4 Gpix camera | 1.4 Gpix camera | Same detectors | wide-field imager |
| Filter set | g r i z y | g r i z y | 5 broad filters | Standard PS1 set |
| Survey strategy | wide-area, many epochs | deep, fewer fields | schedule optimization | trade-off depth vs area |
| Calibration approach | standard photometric calibration | deep-field calibration | uniform across surveys | ensures consistency |
Compiled November 2026; check the provider's site for current details.
Medium Deep Fields: deeper, narrower plays for spectral energy distribution
The Medium Deep (MD) fields in Pan-STARRS1 are the focused counterpoint to the sweeping 3pi survey. They cover roughly 70 square degrees with deeper exposures, designed to push the faint end of galaxy populations and sharpen spectral energy distribution studies. The MD strategy answers a different scientific appetite: higher signal-to-noise data in a smaller patch of sky, enabling more precise photometry and better leverage of multi-band information.
Deeper footprints, tighter footprint
The MD fields concentrate on smaller regions with longer coadds in each band. That deeper cadence yields higher signal in the g, r, i, z, and y filters, which translates into more robust photometric redshift estimates. In practice, the deeper exposures in MD fields improve the leverage for galaxy evolution analyses by reducing the ambiguities that plague single-epoch measurements. This is the sort of tradeoff that makes sense when you want tomography across cosmic time rather than a global census of the sky.
From what I found in the documentation and the archival summaries, the MD program was designed to complement the 3pi data products rather than replace them. The goals are complementary: MD fields deliver spectral energy distribution constraints that the broader 3pi survey cannot as cleanly provide, thanks to higher per-object S/N in a curated set of fields. How to pan-starrs1 data release (dr1 and dr2): what is in it and how to access it: A tight map of what’s inside PS1 DR1 and DR2, and where the
Repeated visits sharpen the astrometry and the time domain
MD fields rely on repeated visits to tighten astrometric precision. The cadence that emerges from these repeats is not just about static measurements. It also tunes transient sensitivity. With more epochs in a smaller area, motion and variability signatures become easier to pick out. The result is a dataset that supports both refined redshift estimation and a more responsive search for variable or transient phenomena within the MD footprints.
This repeated-visit approach also helps calibrate the photometry across epochs. Consistency checks across multiple nights mitigate systematics that could otherwise bias color measurements. The upshot: better color accuracy, better redshift priors, and more reliable SED fits for galaxies that dwell in the middle of the luminosity function.
Data releases paired with papers and guides
Public releases of the MD data appear alongside the science papers that use them. Each data release is accompanied by user guides and technical notes that describe data products, reduction choices, and quality metrics. The combined effect is a clearer path from the raw frames to science-ready catalogs. For students and researchers, the MD lineage provides a more granular view of photometry and astrometry than a single, monolithic release would.
What this means for you as a reader: the MD fields offer a laboratory for testing spectral energy distribution methods in a real, well-documented dataset. You can trace how deeper exposures in a 70 square degree patch propagate into sharper photometric redshifts and more robust galaxy evolution inferences. What Pan-STARRS images reveal about the sky in 2026
The MD fields demonstrate how depth in a focused patch unlocks richer SED science without needing to blanket the whole sky. Higher S/N in five bands, coupled with repeated visits, sharpens both redshift estimates and transient sensitivity.
Cited context: the MD strategy and its relationship to the broader Pan-STARRS1 data products are discussed in the Pan-STARRS1 data archive narratives and the overview papers on the PS1 Surveys. See the MD-focused descriptions in the PS1 data-release literature for specifics on footprint, cadence, and data products.

What the PS1 data releases actually include
Pan-STARRS1 public data releases anchor the PS1 data products that researchers reach for first. The releases package both the sky images and the catalogs that describe what was seen. In 2026 terms, DR1 and DR2 are the core public pillars, with the catalogs and image products built to be used together across science cases.
DR1 and DR2 anchor the public PS1 data products
DR1 established the first large public view of the PS1 survey products, followed by DR2 which expanded both depth and sky coverage. The public data releases provide the stitched image framework and the accompanying source catalogs that are essential for reproducible science. These releases also define the photometric calibration that underpins downstream comparisons across epochs and filters. From the documentation, DR1 and DR2 together form the backbone that most researchers consult for cross-matching sources and validating light curves. The Pan-STARRS1 Surveys - Queen's University Belfast. I dug into the changelog notes and public release pages to map where DR1 ends and DR2 begins, and how each release shifted the calibration anchors and the depth of the catalogs. The Pan-STARRS1 Science Consortium: which institutions took part and what they did in 2026
Catalogs: sources with measured fluxes, positions, and classifications
The catalogs in PS1 include per-source measurements: positions on the sky, fluxes in the five PS1 bands, and sometimes morphology-based classifications. The data model ties each source to its epochal measurements, enabling time-domain work when multi-epoch detections exist. In practice, researchers download a catalog entry for a source and then cross-match to others in the same object or across bands. The meat of the catalogs is the measured fluxes and their uncertainties, plus the astrometric solutions that anchor each detection to the sky. The result is a dataset where a researcher can pull a light curve from multiple epochs and test a transient hypothesis or a steady-state color constraint. Pan-STARRS1: Operations; Public Data Release; Education and …
Images: stacks and single-epoch frames with astrometric solutions
PS1 delivers both single-epoch frames and coadded stacks. The stacks compress multiple exposures into deeper frames, enabling faint-source detection and stable color measurements. Each image product includes a fitted astrometric solution so a user can translate pixel coordinates to celestial coordinates with known precision. Single-epoch frames preserve the temporal footprint, which is crucial for identifying variability and constructing light curves for transients and variable stars. The image products are the primary input for independent photometric pipelines and for archival cross-matching with newer surveys. The Pan-STARRS1 Surveys - Queen's University Belfast.
Calibration: uniform photometric scales across the surveys
Calibration ties all PS1 data to a common photometric scale, aligned across epochs, filters, and releases. Uniform photometric calibration matters when you’re comparing fluxes from DR1 to DR2, or when you’re stitching PS1 data into multi-survey analyses. The documentation emphasizes the photometric uniformity as a design goal for both releases, reducing systematic drift when cross-matching with later datasets or performing population studies. This calibration thread is what makes color-magnitude diagrams from PS1 data more reliable across the survey’s footprint. Pan-STARRS1 data archive home page
The bottom line is simple: DR1 and DR2 are the public face of PS1 data, and they cohere into catalogs and images whose calibration makes time-domain work and multi-band science possible. Researchers rely on the consistent photometric scale and precise astrometry to build reproducible results from the era before Gaia-era catalogs fully took over the cross-match burden. What Pan-STARRS1 has revealed: main results from the survey in 2026
Caveats exist. The PS1 data releases reflect the survey’s design choices and the era’s processing pipelines. Persistent cross-matches can still require careful provenance checks, especially when comparing PS1 sources to newer releases or other sky surveys. But for an astronomy student or researcher, DR1 and DR2 remain the most accessible, well-documented doors into Pan-STARRS1’s sky and its source populations. The data structures are explicit enough to support straightforward retrieval of per-source fluxes, positions, classifications, and accompanying imaging products.

Data products and catalogs availability
| Product | 3pi availability | Medium Deep fields availability | Public releases | Notes |
|---|---|---|---|---|
| Calibrated images | yes | yes | yes | reduced to calibrated stacks |
| Photometric catalogs | yes | yes | yes | multi-band photometry |
| Astrometric catalogs | yes | yes | yes | positions keyed to reference frame |
| Source classifications | yes (basic) | yes (enhanced) | yes | star/galaxy flags |
| Spectral energy distributions | no | yes (deeper) | yes | beyond basic photometry |
Compiled November 2026; check the provider's site for current details.
Data access pathways and what researchers can do with PS1 data
Pan-STARRS data live where astronomers already go for depth and breadth: the MAST PS1 archive. The interface is built around catalogs, image cutouts, and the Casjobs workspace. In practice this means researchers can pull object lists, fetch postage-stamp images, and run SQL-like queries across multiple data products without leaving the portal. The archive is designed with cross-murvey studies in mind, so PS1 data are readily joined to later releases and other surveys when the science demands it. Understanding Pan-STARRS discoveries in 2026: asteroids, comets, and supernovae
How to access PS1 data in 2026
Open with the PS1 public archive on MAST. The site exposes three core interfaces: catalog queries, cutout image retrieval, and Casjobs for batch operations. This triad lets a researcher assemble a target list, verify its photometry, and extract a tailored set of image stamps for follow-up work. For many projects, you can start from a scripted notebook and iterate without leaving the browser.
I dug into the documentation and the example scripts. Python notebooks exist that show how to fetch PS1 photometry, cross-match with ancillary catalogs, and propagate coordinate systems into your analysis. The examples emphasize reproducibility: you can reproduce a catalog cross-match in a single cell and then save the results for a downstream pipeline. The scripts cover common tasks like querying for all objects within a sky region, downloading corresponding image cutouts, and executing a simple photometric calibration check.
Data products and caveats you can rely on
Public releases are intentionally cross-study friendly. The 3pi data products feed into multi-survey studies by design, with careful attention paid to astrometric and photometric consistency across epochs. Researchers can compare PS1 astrometry to later surveys, or align PS1 photometry with external standards when building time-domain samples. The documentation flags caveats: known astrometric systematics, color terms, and filter transmission differences that propagate into cross-survey measurements. In short, PS1 data are usable for many purposes, as long as you account for the documented caveats.
When you read through the changelogs and data release notes, you’ll notice two throughlines. First, the archive team emphasizes provenance and reproducibility. Second, there is a clear path for follow-up work: PS1 now coexists with contemporaneous surveys so you can plan spectroscopic campaigns or deeper imaging on Windows where PS1 data have already flagged interesting candidates. How reporting practices by ATel, GCN, IAU Circulars and MPC evolved in 2026: alert volumes, latency, and citations
What to do next with PS1 data
- Retrieve a sky-area catalog slice, then cross-match with a modern spectroscopic catalog to identify potential targets for follow-up.
- Use image cutouts as a training set for a small targeted variability study. PS1 epochs are numerous enough to reveal bright transients with known light curves.
- Combine PS1 photometry with external standards to attempt a homogeneous re-calibration across surveys for a time-domain project.
Bottom line: PS1 data are intentionally accessible and well-documented for cross-murvey science. The MAST PS1 archive, the Python notebooks, and the Casjobs environment give researchers a practical path from discovery to follow-up, with explicit caveats to keep comparisons honest. Public data releases are designed for cross-murvey studies and follow-up work, and the archive provides an end-to-end workflow from catalog to cutout to analysis. Astrometric and photometric systematics are documented, with caveats that researchers should apply in their analyses.

Catalogs and products: what you actually get
Pan-STARRS1 organizes its data products into two practical streams: catalogs that catalog sources on the sky, and image products that preserve the raw and processed frames. Readers don’t need to hunt for data products. The PS1 data releases bundle everything researchers actually use to build science from positions to light curves. The central idea is simple: you pull a catalog entry to know where a source sits on the sky, how bright it is in one of five filters, and how trustworthy each measurement is. You pull an image product to inspect the source in context and to verify the measurement with the original pixel data.
3Pi catalogs: positions, magnitudes, and quality flags
In the 3pi Steradian Survey, object catalogs deliver three core pillars: precise sky positions, calibrated magnitudes in g r i z y, and a suite of quality flags that flag potential issues. The catalogs encode astrometric solutions tied to the PS1 World Coordinate System (WCS) and provide uncertainties that matter for cross-matching with other surveys. Documentation emphasizes that some sources may be missing in regions of high crowding or near bright stars, and it flags those caveats alongside the measurements. In practice, researchers use the flags to filter out dubious detections before combining PS1 data with external catalogs.
Image products: stacked frames and WCS solutions
The image products are more than pretty pictures. Stacked frames consolidate multiple exposures to improve signal-to-noise, while preserving an accurate WCS that tells you exactly how pixels map to the sky. This pairing, high-quality stacks with resolvable world coordinates, lets you reproduce photometry, verify detections, and perform independent vetting against external data sets. The documentation notes that stacked images come with accompanying metadata that documents the stacking method, the filters used, and the convolution kernels applied, so researchers can reproduce or adapt the workflow for their own analyses.
Cross-matches and multi-survey synergies
A core strength of PS1 data lies in cross-matching capabilities. The catalogs are designed to be interoperable with other large surveys, enabling broad astrophysical inquiries from stellar populations to distant galaxies. The cross-match bridges allow researchers to build wider spectral energy distributions, test color–color selections, and identify unusual objects that only reveal themselves when two or more surveys are compared. This cross-survey compatibility is a deliberate design choice that amplifies the reach of PS1 data beyond its own footprints.
Documentation caveats: missing sources and known systematics
No data release is perfect. The PS1 documentation consistently flags missing sources in crowded regions and near bright stars, along with known systematics that affect photometry and astrometry. Users are urged to apply the provided quality flags and, where possible, to account for edge effects and calibration drifts when interpreting results. The warnings matter because they influence how one interprets detections near the survey boundaries or in photometric bands with lower sensitivity.
The catalogs and images are designed to be your first checkpoint for PS1 science, not the final word. The real value comes from using the catalogs to locate objects and the images to verify measurements, all while respecting the documented caveats.

Access pathways and user workflows
| Pathway | 3pi access | Medium Deep access | Both | Notes |
|---|---|---|---|---|
| Online interface | browse/search | browse/search | both | web portals |
| Data downloads | bulk + API | bulk + API | both | FTP/HTTP/API |
| Catalog cross-matching | supported | supported | both | tools available |
| Documentation | available | available | both | usage guides |
| Data rights | standard PS1 terms | standard PS1 terms | standard terms | citation needed |
Compiled November 2026; check the provider's site for current details.
The 3pi survey and Medium Deep fields reshape Pan-STARRS1's legacy for 2026 and beyond
I looked at how the 3pi survey and the Medium Deep fields extend Pan-STARRS1’s reach into three sky regions with deeper, repeated imaging. From what I found, the synergy between wide-area coverage and targeted depth redefines how researchers map faint transients and distant galaxies. The data release cadence, tied to the instrument’s baseline cadence, creates a practical path for time-domain studies and archival cross-matches with newer surveys.
In this light, the narrative shifts from a historical account to a forward-facing roadmap. The real story isn’t just the sky coverage, but how the 3pi strategy prioritizes uniform photometry across heterogeneous fields, enabling robust host galaxy associations and improved photometric redshifts. The take-away is that Pan-STARRS1’s legacy scales through 2026 by preserving consistency even as depth and cadence evolve. Researchers and students can leverage these data products to calibrate upcoming surveys, with the Medium Deep fields serving as a blueprint for deep, repeatable imaging. What’s next will hinge on cross-referencing with contemporaries like ZTF and LSST previews to co-validate transient catalogs.
Next steps:
- Explore cross-matches between Medium Deep fields and LSST-era datasets for rapid transient localization.
- Check latest public releases for updated photometric calibrations and time-domain alerts.
- Compare 3pi field depths across epochs to plan follow-up candidate selection.
Frequently asked questions
What is the pan-starrs1 3pi survey
The 3pi survey is Pan-STARRS1’s all-sky component, covering roughly a steradian-wide footprint around the celestial sphere. It uses the PS1 telescope to map the sky in multiple passbands with uniform cadence. The goal is to provide homogeneous, wide-area imaging for statistical studies of faint objects and to anchor deeper fields. The survey strategy emphasizes consistent photometric calibration and astrometric accuracy across the full footprint. Key numbers: it spans about 3π steradians, reaches millimagnitude-level photometry consistency in the grizy bands, and complements the deeper fields. This section explains definitions, coverage, and how the data feed into subsequent analyses. The 3pi survey sets the baseline for Pan-STARRS1 sky coverage and uniformity.
How many epochs does pan-starrs1 3pi have
The 3pi survey comprises many epochs per sky location, but the exact number varies by field due to observing conditions and filter strategy. In general, the wide footprint accumulates tens of epochs per band, with specific repeat counts documented in the survey design papers and data release notes. The cadence is optimized for reliability and uniformity across the sky rather than for ultra-deep single-epoch imaging. Readers should consult the PS1 data release metadata for the precise epoch count at a given sky coordinate, since numbers differ between bands and over time. This cadence underpins the survey’s photometric stability and artifact rejection.
What are pan-starrs1 medium deep fields
The Medium Deep Fields are deeper, narrower regions chosen to probe spectral energy distributions with higher fidelity. They concentrate observing time on a small number of fields, producing deeper coadds in multiple filters than the wide 3pi footprint. The fields enable more precise photometry, improved color measurements, and robust galaxy and stellar population studies. They serve as bridge regions between the wide survey and targeted follow-up, delivering higher signal-to-noise for faint objects while maintaining cross-calibration with the wide-area data.
Where can i access pan-starrs1 data
PS1 data are accessible through the Pan-STARRS1 Data Archive portals and associated data release pages. Researchers typically use the PS1 Science Consortium interfaces, the MAST mirror for PS1, and the project’s data release documentation to fetch images, coadds, and catalogs. Access routes include region-based query tools, bulk downloads of image cutouts, and programmatic access via API endpoints. The documentation emphasizes stable pointing histories, consistent photometric calibrations, and clear metadata fields to enable reproducible analyses.
What filters does pan-starrs1 use
Pan-STARRS1 operates with the grizy filter set, mirroring a broad optical range from the green to near-infrared. The filter transmission curves, calibration, and zeropoints are defined in the PS1 documentation and data release papers. The filter set supports broad-band photometry suitable for stellar classifications, galaxy color studies, and cross-match comparisons with other surveys. Precise filter transmission curves and zeropoint details are critical for accurate color measurements and for cross-survey comparisons.
How deep are pan-starrs1 medium deep fields
The Medium Deep Fields reach considerably greater depth than the 3pi footprint, achieving lower photometric uncertainties at faint magnitudes due to coadded integration times and multiple epochs. Reported depths vary by filter and exact field, but the intent is to push several tenths of a magnitude deeper than the wide survey in the same bands. The resulting catalogs enable improved color diagnostics and more robust spectral energy distribution fits for faint sources.
What is the data release 2 for pan-starrs1
Data Release 2 (DR2) aggregates a defined later set of PS1 products, including updated calibrations, expanded catalogs, and refined astrometry. DR2 improves photometric zeropoints, artifact masking, and coadd quality. It also clarifies the metadata schema and provides corrected error estimates. The release notes specify which fields, epochs, and object catalogs are included, along with any known limitations or caveats for users performing cross-match analyses.
How to cross-match pan-starrs1 with Gaia
Cross-matching PS1 with Gaia relies on sky position, proper motions, and photometric consistency checks. Use a positional tolerance appropriate for Gaia’s astrometric accuracy and the PS1 pointing uncertainties, typically a few tenths of arcseconds to a couple of arcseconds depending on epoch and source density. Enforce quality flags from both catalogs, compare colors when possible to separate stars from galaxies, and account for epoch differences due to proper motion. Documentation and community recipes provide recommended match radii and handling of crowded fields.
What are common systematics in pan-starrs1 data
Common systematics include residual flat-field errors, imperfect bias subtraction, and artifacts around bright stars. Photometric zeropoint variations across the focal plane and time-dependent atmospheric extinction can imprint small color terms as well. Astrometric residuals may appear in high-density regions or near bright sources. The PS1 data releases document calibration covariances, mask out known defects, and provide quality flags to help researchers screen problematic measurements.
How does pan-starrs1 inform future surveys like LSST
PS1 established a blueprint for wide-field, multi-epoch optical surveys. Its learned lessons include the importance of uniform photometric calibration, robust artifact masking, and transparent metadata. The Medium Deep Fields foreshadow how deeper, narrower fields can complement wide-area mapping. The experience with data products, reduction pipelines, and cross-survey calibration informs LSST’s approaches to processing, calibration, and data access, guiding standardization efforts and community tools.
What is ps1 gpc1 camera specifications
The PS1 GPC1 camera is a wide-field imaging instrument designed for the Pan-STARRS1 telescope. It employs a mosaic of CCDs to cover a broad field of view with high quantum efficiency in the optical bands. Specifications cover the detector layout, readout noise, gain, dark current, and pixel scale, factors that influence image depth, astrometric precision, and the survey’s cadence. The instrument’s performance frames the quality of the 3pi survey and the depth of the Medium Deep Fields.
How to retrieve pan-starrs1 image cutouts
Image cutouts from PS1 can be retrieved via the PS1 data archive interfaces and allied mirrors. The process typically involves selecting a target coordinates or a region, choosing the desired band and resolution, then submitting a download request. You can automate cutout retrieval with the archive’s API or batch tools for multiple targets. Documentation highlights file formats, coordinate systems, and WCS headers to ensure you can reproject the images for your workflow.
What is included in pan-starrs1 object catalogs
PS1 object catalogs include photometric measurements in the grizy bands, along with astrometric positions, shape descriptors, and quality flags. The catalogs also feature cross-match identifiers, uncertainties, and sometimes derived quantities such as photometric redshifts for galaxies. The data release notes spell out the flag definitions, magnitude limits, and selection criteria used to populate the catalogs.
How to interpret pan-starrs1 photometry across bands
Interpreting PS1 photometry requires consistent zeropoints, color terms, and an understanding of the bandpass differences with regard to standard systems. Use the provided zeropoints and extinction corrections, examine color–color diagrams to separate stellar types, and account for depth differences between bands when combining measurements. The data release documentation provides recommended color indices and cautions about saturated or blended sources.
What are the main science goals of pan-starrs1 surveys
The main science aims include creating a uniform, wide-area optical map of the sky for statistical studies of faint stars, galaxies, and transient populations. PS1 supports structure formation, Galactic archaeology, stellar photometry, and cross-survey cosmology efforts. The Medium Deep Fields complement this by enabling precise spectral energy distribution measurements and higher-fidelity photometry in a deeper, narrower context, sharpening studies of faint object populations.