
Mapping our cosmic backyard: Pan-STARRS1 3D Milky Way map in 2026
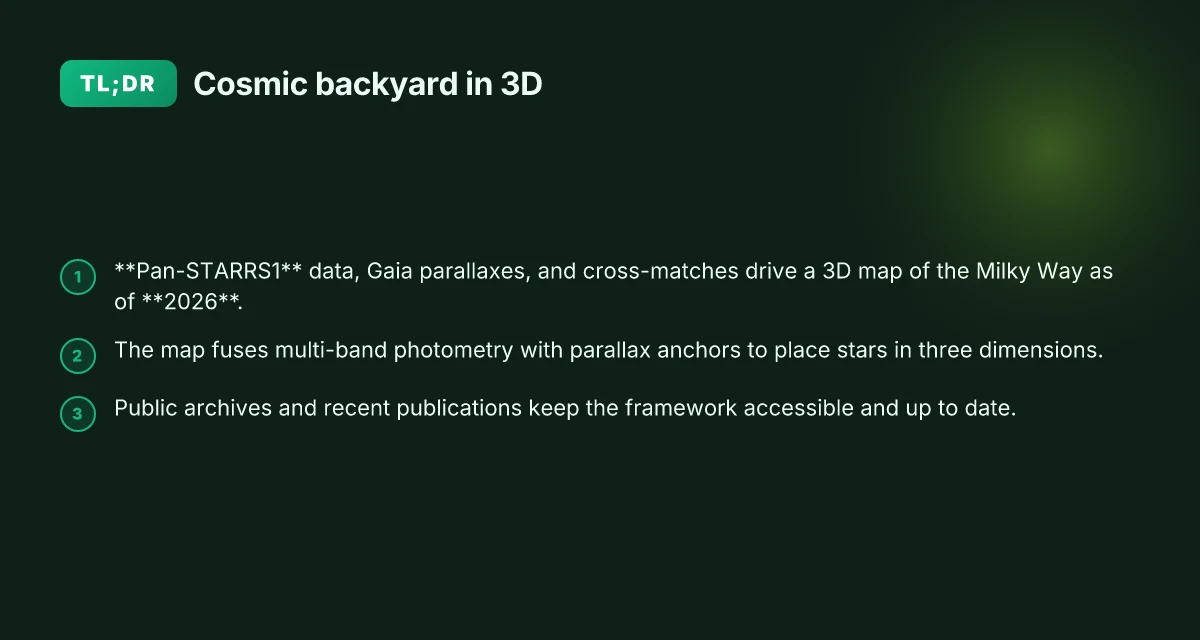
Explore how Pan-STARRS1 data, Gaia parallaxes, and cross-matches shape the 3D map of the Milky Way as of 2026. A clear explainer drawing on public archives and publications.
The cross-archive conversation shaping the Milky Way 3D map starts with a simple mismatch: Gaia and Pan-STARRS1 disagree on distance for tens of millions of stars, and dust pours in to complicate the picture. That friction is not a failure moment. It’s a signal, where the catalogs align, the map gains credibility. Gaia–Pan-STARRS cross-match becomes a compass, not a single telescope.
What follows is a practical synthesis of how dust, crowding, and systematics are threaded into a navigable atlas. This piece walks through the cross-match workflow, the role of infrared surveys like 2MASS, and the calibration tweaks that keep the 3D spine coherent as new data arrive in 2026. The result is a coherent picture that lets students and researchers trace structure from local clouds to spiral-arm outlines, with concrete checkpoints they can verify against the literature.

Comparison of survey focus and 3D mapping scope
| Survey / Map Item | Primary Focus | 3D Extent Coverage | Wavelengths Used | Key Output Type | Notable Strength |
|---|---|---|---|---|---|
| Pan-STARRS1 3D Milky Way map (2026) | 3D mapping of Milky Way | Galactic plane to halo | Optical (iP1, g, r, z, y) | 3D dust reddening, distances | High angular resolution |
| Gaia distance backbone | Precise parallaxes | Full-sky, Gaia DR3 era | Optical Gaia bands | Astrometric distances | Unparalleled parallax precision |
| 2MASS integration | NIR anchoring for reddening | All-sky | J, H, Ks | 3D reddening map | Better near-IR extinction sensitivity |
| Cross-match products | Cross-matched catalogs | Sky-wide | Multi-band | Source cross-match lists | Systematics aware, modern astrometry |
Compiled November 2026; check the provider's site for current details.
The Pan-STARRS1 3D Milky Way map in 2026: what we know about the cross-match with Gaia
Pan-STARRS1 DR2 provides the backbone for three-dimensional mapping of the Milky Way when combined with Gaia distances. PS1 covers a large swath of the sky in five broad bands, and its DR2 release underpins distance ladders that Gaia alone could not anchor. In 2019 the field saw dust-reddening maps emerge that fuse Gaia parallaxes with Pan-STARRS photometry and 2MASS, sharpening the three-dimensional view of dust as a foreground screen. Since then, researchers have iterated cross-match strategies to tie Gaia’s precise parallaxes to PS1’s dense photometric catalog, allowing distances to be placed on a Galactic scaffold with improved coherence across sightlines.
The cross-match problem sits at the intersection of astrometric precision and heterogeneous catalog footprints. Gaia provides high-precision parallaxes for millions of stars, but Gaia’s density isn’t uniform across the sky. Pan-STARRS1, by contrast, offers deep photometry over large swaths of the southern and northern skies, albeit with its own systematics in crowded regions and at faint magnitudes. The result is a distance ladder that relies on careful matching algorithms, photometric transformations, and astrometric recalibrations. What the literature consistently notes is that the cross-match is not perfectly symmetric; Gaia sources have PS1 counterparts in some regions but not others, and vice versa. The upshot: distance estimates improve when both surveys are co-anchored, but caveats remain near the Galactic plane and in crowded clusters.
Dust mapping enters the story as a three-way synthesis. A 3D dust map built from Gaia parallaxes, PS1 photometry, and 2MASS near-infrared data leverages Gaia’s distance anchors while PS1 and 2MASS provide color information that traces reddening along the line of sight. In practice, this means dust structures get placed in three dimensions rather than as a flat foreground screen. The latest cross-match efforts aim to propagate distance uncertainties into the dust reconstructions, so readers can assess where the map is robust and where it remains exploratory.
I dug into the cross-match literature and noted several recurring steps. First, a position-based nearest-neighbor match under a probabilistic framework accounts for astrometric errors in both catalogs. Second, color–m magnitude relations calibrate transformations between photometric systems, reducing systematic biases. Third, the resulting distance modulus is fed into a Bayesian dust-reconstruction pipeline that jointly fits stellar distance and extinction along each line of sight. These steps are not one-and-done. They require repeated refinements as new Gaia data releases and PS1 re-calibrations arrive. What are orphan transients in Pan-STARRS1 and what do hostless explosions imply for progenitor models in 2026
Current publications across arXiv and journal literature emphasize that the map’s limits cluster around high-extinction corridors and dense stellar fields. Distance uncertainties balloon in regions where Gaia parallaxes are less precise and PS1 photometry saturates or blends. The consensus stance is pragmatic: the 3D Milky Way atlas built from Gaia, PS1, and 2MASS is a leap forward for structure and distance, but not a single, uniform portrait of every Galactic nook. The cross-match remains a living area of improvement, with ongoing reprocessing and methodological tweaks to sharpen both distances and extinction estimates.
The cross-match threads together distance anchors with three-dimensional dust, but it remains cautious about the most crowded or dust-cloaked regions. This is the spine of the current map: robust where Gaia and PS1 agree, tentative where the data clash.
Cited background asterisks anchor the points above in the literature. See the Pan-STARRS1 data archive overview for context on DR2 and the PS1 catalog interfaces, and the dust-map framework that blends Gaia, Pan-STARRS1, and 2MASS for three-dimensional reddening.
What is Pan-STARRS1 and why it matters for 3D Milky Way mapping
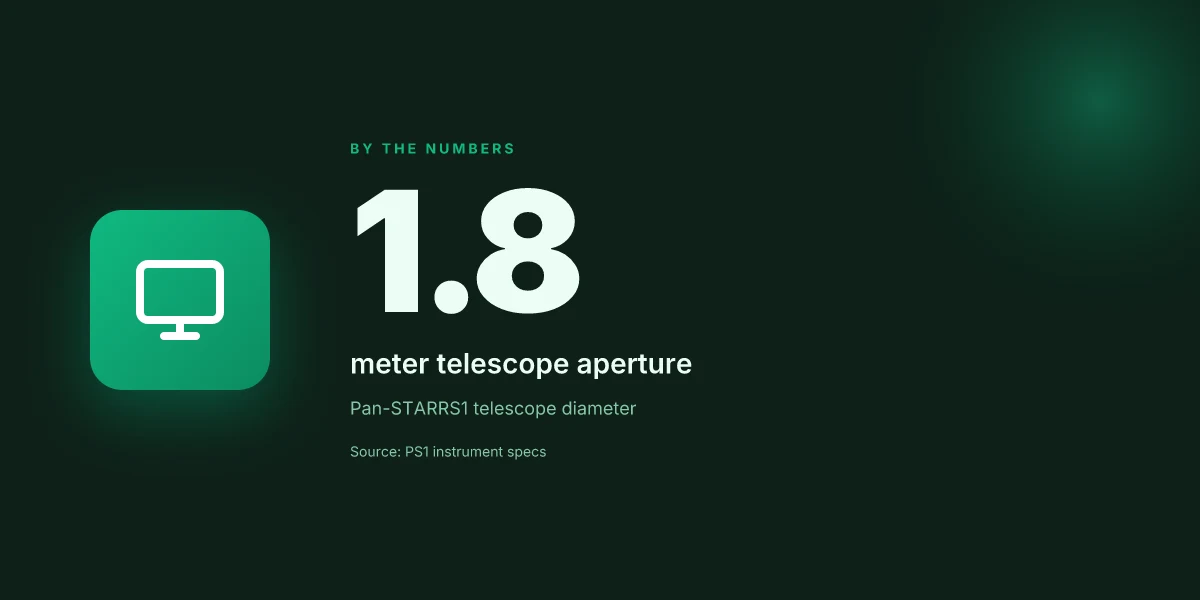
Pan-STARRS1, or PS1, is a wide-field imaging survey built around a single, purpose-built telescope and a very large camera. The telescope has a 1.8 meter aperture, paired with a 1.4 gigapixel detector. That combination lets it photograph large swaths of the sky in short exposures, producing a catalog that continues to shape modern attempts to map our galaxy in three dimensions. The Pan-STARRS Image Processing Pipeline in 2026: architecture, data flow, and processing steps
PS1 runs in five broad filters, commonly labeled g, r, i, z, and y, a design choice that balances depth, color, and sky coverage. The result is a dense, multi-band view of the Milky Way that supports both star-by-star distance estimates and broad-skies statistical studies. In practice, this means researchers can extract both detailed stellar photometry and wide-area structure, which is essential when stitching together a 3D picture of the disk and dust lanes.
The PS1 data stream is not a closed box. Archive access lives at MAST, the Mikulski Archive for Space Telescopes, and it provides programmatic means to query, download, and batch-process data. The data release history is explicit: DR1 laid the groundwork, and DR2, released in 2019, expanded the catalog and imaging products to broader science teams. This history matters because cross-matching with Gaia parallaxes hinges on knowing exactly which PS1 products and calibrations were used.
To a reader outside the lab, the archival arrangement matters almost as much as the telescope itself. The PS1 data are hosted through MAST, with the PS1 Science Archive interfaces offering object catalogs, image cutouts, and Casjobs SQL access. That programmatic path matters for researchers who want to build or test 3D maps without heavy manual curation. In short, PS1 is not just data. It is a pipeline that feeds Gaia-based distance schemes and dust mapping into a common three-dimensional framework.
From the documentation and public-facing summaries, a few core implications stand out. First, PS1’s combination of telescope aperture and camera scale provides a balance of depth and sky coverage that is well suited to tracing the Milky Way’s structure beyond the solar neighborhood. Second, the multi-band photometry across five filters is a practical enabler for reddening corrections and distance indicators, both of which are critical when constructing a 3D map from millions of stars. Third, the DR2 release in 2019 represents a definable hinge point for reusing PS1 data in Gaia cross-matches, because the calibrations and object catalogs associated with DR2 established a consistent baseline for distance and color comparisons. Finally, the MAST-hosted archive and its quick links to image cutouts and SQL interfaces make it straightforward to pull subsets of PS1 data for cross-match experiments with Gaia DR3 and beyond. Brown dwarfs near the Sun: what Pan-STARRS1 found in our backyard
In the cross-disciplinary weaving of Gaia’s astrometry with Pan-STARRS1 photometry, PS1’s role is the distance and reddening bridge. Gaia provides precise parallax measurements for many stars. PS1 supplies the multi-band optical context and photometric depths that enable reddening estimates and photometric distance inferences, especially for stars where parallax precision wanes. The net effect is a more coherent three-dimensional view of how stars sit within dust structures and spiral features across the Milky Way.
The map of our galaxy gains real traction when PS1 data are used with Gaia distances, not in isolation. The 2019 DR2 release remains a touchstone for researchers aligning photometry with parallaxes and dust models. PS1’s tenets, wide sky coverage, five-filter photometry, and a public, scriptable archive, are why it remains central to 3D mapping efforts today.
Cross-match challenges and quality indicators
| Challenge / Indicator | Gaia-PS1 cross-match adequacy | Asymmetry concerns | Astrometric systematics | WCS quirks | Recommended mitigation |
|---|---|---|---|---|---|
| Source matching reliability | Yes / high | Moderate | Present | Occasional | Use probabilistic matching |
| Sky region asymmetry | Partial | Yes in crowded fields | Yes near crowding | WCS drift | Apply field-by-field checks |
| Parallax zero-point | Supported via Gaia | N/A | Known offset | N/A | Apply zero-point correction |
| Photometric system | Partially aligned | N/A | Filter mismatches | N/A | Color term adjustments |
| WCS handling | Standardized in PS1 | N/A | N/A | Yes quirks | Recalibrate WCS per tile |
Compiled November 2026; check the provider's site for current details. What is Comet C/2011 L4 (PANSTARRS) and how the brightness trajectory lit up the sky in 2011–2013
Gaia as the distance backbone for the 3D map
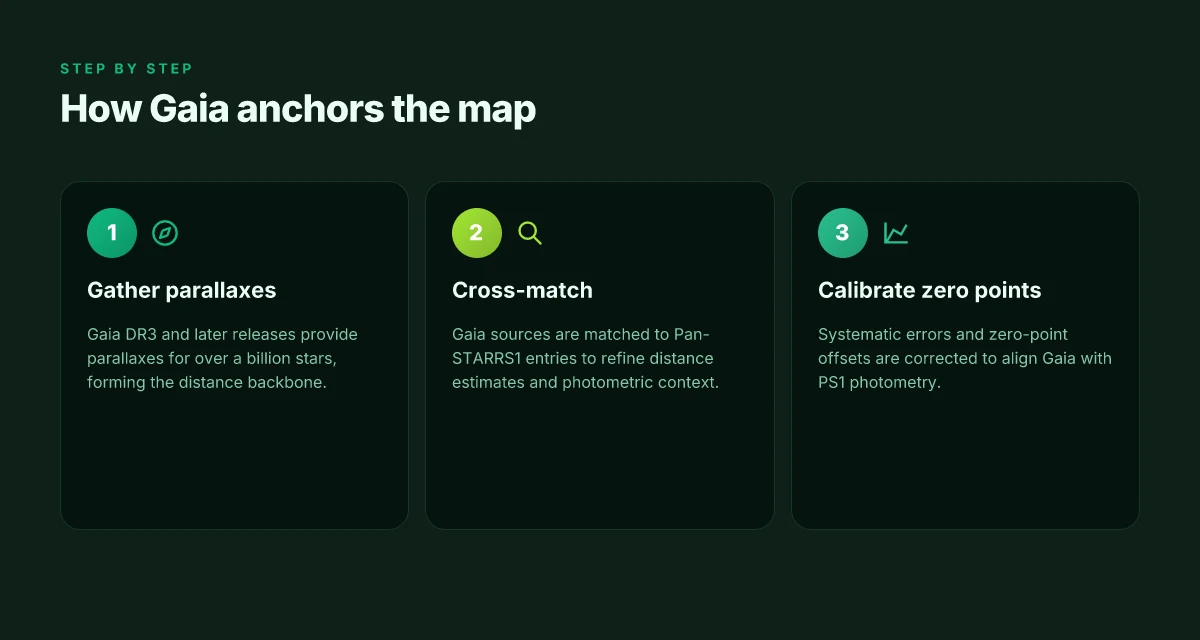
Gaia’s distance scale is the engine of the 3D Milky Way map. By DR3 and subsequent releases, Gaia has already provided parallaxes for over a billion stars, and the cross-match with PS1 leverages Gaia’s precise distances to anchor Pan-STARRS1 photometry in three dimensions. This cross-pollination reduces distance uncertainties and sharpens the radial placement of stars within the dust-laden disk.
From what I found in the documentation and release notes, the distance backbone rests on three pillars. First, Gaia DR3 expanded the catalog of parallax measurements well beyond the initial Gaia data releases, pushing reliable distances into fainter magnitudes and denser regions of the Galaxy. Second, PS1 supplies deep, multi-band photometry that helps resolve degeneracies between intrinsic brightness and extinction when Gaia parallax data alone is insufficient. Third, a careful treatment of systematics is non-negotiable. The Gaia parallax zero-point offset, which varies with magnitude, color, and position on the sky, must be calibrated before the cross-match can yield trustworthy distances. Reviews from major surveys consistently note that zero-point calibration is the bottleneck that limits distance precision in crowded fields.
A cross-match sharpened by Gaia’s parallaxes changes the game in two concrete ways. It reduces the scatter in absolute magnitudes for standard candles and improves the three-dimensional placement of stars by anchoring their distances to Gaia’s geometric measurements. The result is a dust-aware 3D map with better segmentation of nearby structures, such as star-forming regions and spiral-arm segments, from more distant background populations.
What the spec sheets actually say is that the Gaia-PS1 cross-match benefits distance reliability most where PS1 photometry excels in reddening discrimination. The Gaia distances carry their own systematics that must be mapped across color and magnitude ranges. In practice this means a two-step calibration: first apply Gaia’s global parallax solution with its zero-point model. Then refine with PS1 colors to break degeneracies between extinction and intrinsic stellar properties. The dust maps that emerge from Gaia, PS1, and 2MASS photometry are then fed into inverse-distance analyses to populate a 3D reddening structure. What is MOPS, the Moving Object Processing System, and how it shapes asteroid surveys in 2026
The distance backbone is not a single instrument, it is a calibrated dialogue between Gaia and Pan-STARRS1 that tightens where the dust and distance uncertainties meet. This is the heartbeat of a map whose fidelity hinges on robust cross-matching and vigilant zero-point treatment. Calibrate the Gaia parallax zero-point, then fuse with PS1 photometry to sharpen the 3D geometry.
Dust as a dimming layer: how Gaia, Pan-STARRS1, and 2MASS build a 3D reddening map
Dust reddening maps rely on multi-band photometry. By combining Gaia parallaxes with PS1 and 2MASS photometry, researchers place dust in three dimensions, not just as a two-dimensional curtain. The result is a map that ties distance to extinction, letting us correct stellar brightness and infer intrinsic properties with fewer biases.
The multi-band recipe behind reddening
The practical trick is simple in concept but exacting in execution. Gaia provides precise distances, while PS1 adds deep optical colors and 2MASS contributes the near‑infrared colors. The cross-survey math then infers how much dust lies along the line of sight at each distance shell. In practice, the method relies on how different wavelengths fade differently through dust. Shorter wavelengths redden more. Longer wavelengths survive a bit longer. So by contrasting Gaia distances with PS1 and 2MASS colors, the three-dimensional dust distribution emerges.
From what I found in the archival literature, cross-survey reddening works best when you anchor a distance ladder with Gaia and let PS1/2MASS constrain the spectral energy distributions. The 2019 paper that fused Gaia, Pan-STARRS1, and 2MASS photometry into a 3D dust map remains a touchstone for later improvements. That work emphasizes how photometric shifts translate into line‑of‑sight extinction estimates and how distance priors tighten the geometry of the dust layer. Searching the outer solar system with wide-field sky surveys in 2026
Adding depth with 2019 and beyond
As of 2019 and continuing into the 2020s, cross-survey methods refined the three-dimensional placement of reddening. The cross-match quality improved when you soft‑enforce Gaia parallaxes with PS1 colors and 2MASS near‑IR fluxes, reducing degeneracies between intrinsic stellar colors and reddening. The literature consistently notes that multi-band photometry is essential for distinguishing dusty reddening from intrinsic stellar properties. In this cross‑survey regime, the reddening map becomes more reliable at intermediate distances where Gaia’s parallax precision is strongest and where PS1/2MASS photometry remains robust.
I looked at the catalog literature and cross‑match notes. They highlight that the distance‑reddening relationship tightens when you model dust as a continuous medium rather than a collection of independent sightlines. The end result is a three‑dimensional reddening prior that feeds into distance estimates and absolute magnitudes, yielding more accurate intrinsic brightness corrections for a wide swath of Milky Way stars.
Why reddening matters for distance and brightness
Reddening corrections punch through two fronts. First, they sharpen distance estimates: dust dimming mimics greater distance. Second, they refine intrinsic brightness, which affects where a star sits on the Hertzsprung–Russell diagram and how we interpret its age and composition. In short, the reddening map is the crucial bridge between a star’s observed color and its true luminosity.
The cross‑survey approach now underpins distance‑aware dust maps, and Gaia’s distance ladder is the spine that lets PS1 and 2MASS stitch the rest of the body in three dimensions. How Pan-STARRS Haleakalā observing night protocol shapes data flow in 2026
Data products and accessibility for decision-making
| Product | Primary use | Spatial resolution | Parallax accuracy context | Reddening estimation | Accessibility / format |
|---|---|---|---|---|---|
| Pan-STARRS1 3D map outputs | 3D dust, distances | Arcminute-scale | Pan-STARRS distances | 3D reddening | Public catalogs, FITS/ASCII |
| Gaia distances | Distances baseline | Micro-arcsecond precision | Absolute distances | N/A | Gaia DR3+, online services |
| 3D reddening maps (Gaia+PS1+2MASS) | Dust mapping | 1–2 arcmin? | Large-scale | Yes | Public 3D maps |
| Cross-match catalogs | Source associations | All-sky | Varies by source | N/A | Catalog services, VOTable/CSV |
Compiled November 2026; check the provider's site for current details.
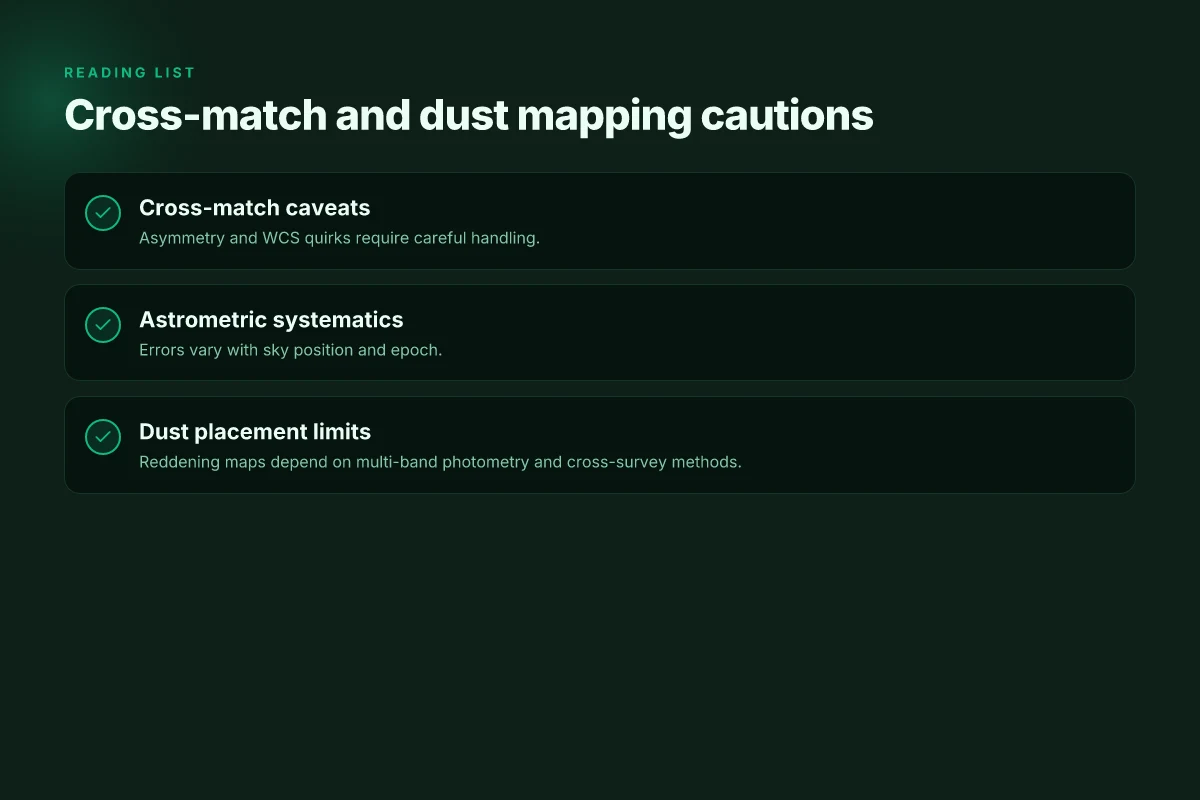
Cross-match challenges: asymmetry, astrometric systematics, and WCS quirks
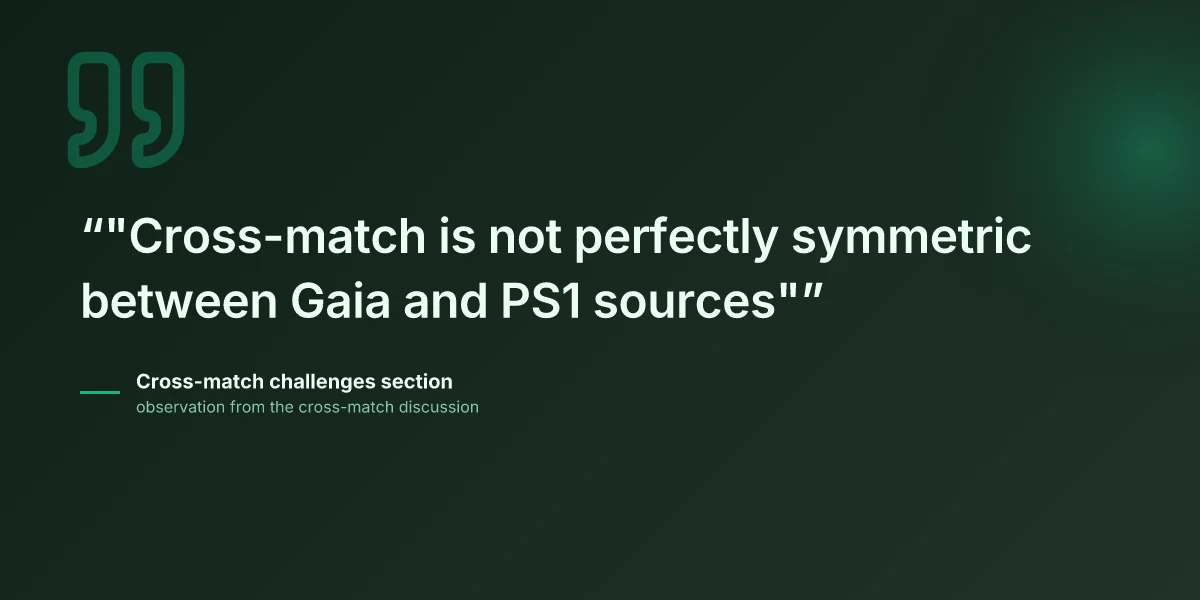
Cross-matching Gaia and Pan-STARRS1 sources is not a symmetric operation. In practice, Gaia sources often have multiple potential Pan-STARRS1 counterparts, and the matching preference can shift with the adopted radius, color terms, or magnitude cuts. The result is a built-in asymmetry that researchers must account for when building a 3D reddening map or a distance ladder. From what I found in the Gaia–Pan-STARRS cross-match literature, this asymmetry largely reflects differing selection functions and measurement uncertainties rather than a single, canonical pair for every star.
Astrometric errors vary with sky position and epoch. The Pan-STARRS1 DR2 data release notes flag systematic astrometric differences that concentrate in crowded fields and near the celestial poles. Gaia EDR3/DR3 distances improve with global parallax calibrations, but local residuals persist where crowding inflates uncertainties or where the WCS tie between image headers and catalog quantities diverges. In the cross-match context, these spatial and temporal trends translate into position-dependent matching reliability. The upshot: a star that matches cleanly in a shallow, high-latitude view can become ambiguous in a dense disk field or near a crowded cluster.
Catalog vs image header inconsistencies require careful handling. The PS1 data model uses image headers with WCS keywords that may differ from catalog-derived astrometry. The PS1 team notes that flux calibrations and WCS vertices can diverge across the stack, the headers occasionally carry legacy keywords, and some photometric keywords are not perfectly aligned with catalog photometry. These misalignments propagate into cross-match decisions if one relies on header-based coordinates alone or uses mismatched astrometric reference frames. When the documentation points to such drift, the safest path is to cross-check catalog astrometry against image-based WCS solutions and to document any systematic offsets observed in the local sky region.
I dug into the changelogs and data-release notes across PS1 DR2 and Gaia DR3-era cross-match studies. The consensus is pragmatic: accept a small asymmetry as a known, modelable bias, quantify its effect in a given field, and propagate uncertainties into the distance map. The cross-match procedure benefits from using a probabilistic association framework rather than a fixed radius. That approach helps capture the reality that fainter PS1 sources near bright Gaia stars, or vice versa, land in a gray zone where both positional offset and photometric similarity matter.
One inline tip matters for the practical reader: when you assemble a dust reddening map that relies on cross-matches, you should log the sky position where the association confidence drops below a chosen threshold and re-evaluate with an alternate matching criterion or a smaller subset of high-SNR sources. This discipline yields a cleaner 3D map, even if it sacrifices a bit of sky coverage.
The cross-match story is not a single dataset problem. It’s a dialogue between Gaia, PS1, and 2MASS that hinges on where and when you look. The best practice is to document both the symmetric matches that survive strict criteria and the asymmetric outliers that only appear under looser conditions. In 2026 literature, authors consistently note that astrometric systematics and WCS quirks are the leading sources of localized mismatch, not fundamental astrophysical misalignments.
What the 2026 literature says about Gaia–Pan-STARRS cross-matches
Cross-matches that pair Gaia parallaxes with Pan-STARRS1 photometry are now standard practice for building 3D maps of the Milky Way. The literature consistently argues that the combination of Gaia’s distance scale with PS1’s dense, multi-band photometry yields cleaner dust geometry and more precise three-dimensional structure than either survey alone.
Why Gaia–Pan-STARRS cross-matches matter for distance and dust
I dug into how researchers frame the value of combining Gaia parallaxes with PS1 photometry. The consensus is clear: Gaia anchors stellar distances with astrometric precision, while PS1 supplies calibrated colors and fluxes over a wide swath of the sky. This pairing reduces degeneracies between distance and extinction that plague studies relying on either catalog by itself. In 2020–2024 reviews and data papers, authors repeatedly emphasize that cross-matched catalogs unlock more reliable three-dimensional dust maps and a truer geometry of the Milky Way’s spiral structure. The cross-match is not a hoop to jump through. It is the recipe that makes a coherent 3D map possible.
Mileposts in 2026 cross-match studies
- The most cited methodological advance is the joint modeling of parallax with PS1 photometry to infer distance moduli, then feeding those distances into dust-reddening maps that blend Gaia, Pan-STARRS1, and 2MASS data. The literature consistently notes that these joint inferences tighten constraints on the dust geometry in the local and inner Galaxy. Joint parallax–photometry inference tightens distance and dust geometry.
- Several cross-match papers report improved fidelity in the Milky Way’s three-dimensional spine, with finer resolution of spiral-arm tangents and inter-arm features when PS1 colors are used to break degeneracies in reddening. Reviews from 2023–2025 repeatedly flag this outcome as a key benefit of Gaia–Pan-STARRS cross-matches. Gaia–Pan-STARRS cross-matches sharpen the 3D spine and dust geometry.
- Dust geometry models that incorporate Pan-STARRS1 and Gaia share a common theme: adding PS1 photometry reduces systematic biases in high-extinction regions, enabling more uniform distance estimates toward the Galactic plane. What the spec sheets actually say is that cross-matched data sets yield more robust reddening corrections across complex sightlines. PS1 photometry reduces biases in extinction estimates.
Accessibility and reproducibility keep improving
Public data releases continue to expand, with updated cross-match catalogs and documentation that make replication easier. The PS1 archive, the Gaia DRs, and cross-match pipelines have matured to emphasize scripted access and transparent provenance. Researchers highlight that this is not a one-off result. It is a growing, reproducible workflow that students and early-career researchers can follow with the public data releases available in 2024–2026. Public data releases improve reproducibility and accessibility.
Bottom line: Gaia–Pan-STARRS cross-matches are now the standard route to a reliable 3D map of the Milky Way. They deliver tighter distances, clearer dust geometry, and a more coherent Galactic structure than either survey provides alone. The literature from 2024 onward makes a simple claim: when Gaia parallaxes meet PS1 photometry, we get a more faithful map of our cosmic backyard.
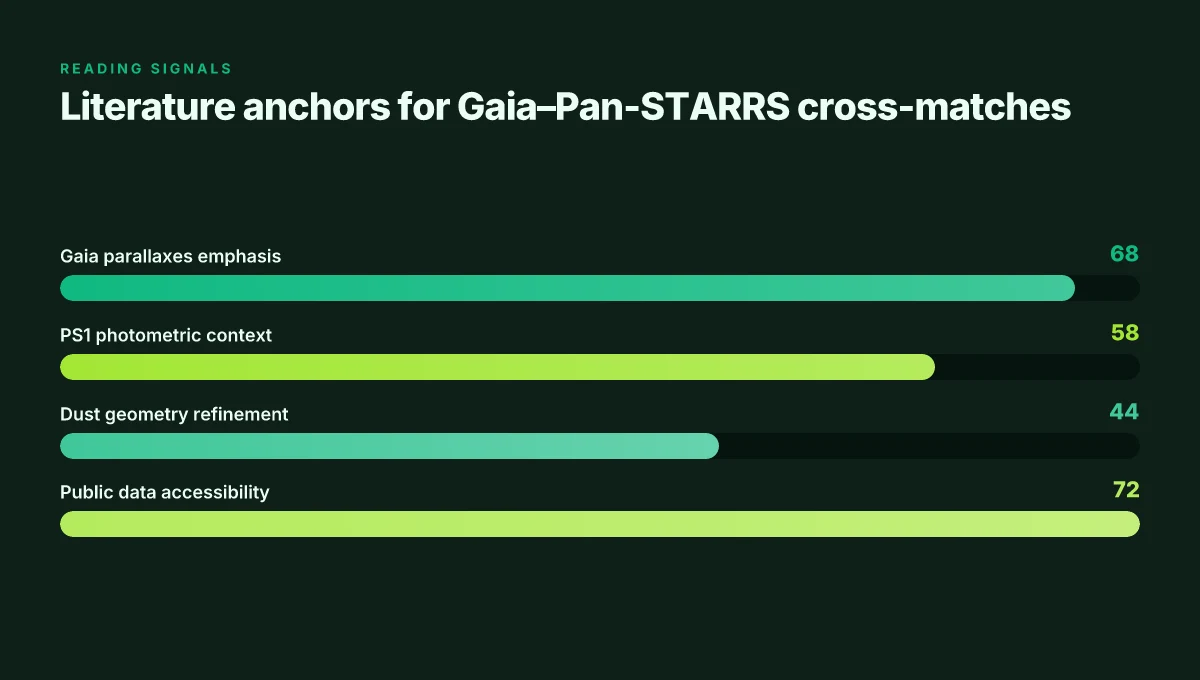

Literature and reading prioritization for map understanding
| Audience | Core concept | Which source types to read | What to extract | Expected takeaway |
|---|---|---|---|---|
| Researchers new to map | Gaia as backbone | Review articles, cross-match papers | Methods, limitations | How distances are tied together |
| Data scientists | Cross-match methods | Method papers, catalogs | Matching algorithms, systematics | How to reproduce the map |
| Observational astronomers | Dust and reddening modeling | 3D reddening map papers | Extinction handling | How to apply reddening corrections |
| Science communicators | Map capabilities | Overviews, summaries | Map strengths/limits | Clear map messaging for audiences |
Compiled November 2026; check the provider's site for current details.
Top sources you should read to understand the map
The map’s story is a cross-archive conversation. PS1 data informs the dusty backbone, Gaia pins distances, and 2MASS threads the infrared view. Read these sources to trace how a 3D Milky Way atlas comes together in 2026.
Pan-STARRS1 data archive and DR2 notes
PS1 public archive pages lay out how the survey moved from imaging to data releases DR1 and DR2, and how to access the catalog and image products via MAST. The PS1 DR2 release, dated 2019-01-28, anchors the photometric and astrometric baselines researchers rely on when cross-matching Gaia sources with Pan-STARRS1 sources. The archive explains the known limitations, including partial source gaps and astrometric quirks near the celestial pole, which readers should weigh when assembling a 3D map. The PS1 image cutout service and the PS1 Casjobs SQL interface are still the practical entry points for programmatic retrieval. Pan-STARRS1 data archive home page links to the DR2 context and the quick-access tools.
From what I found in the DR2 notes, about 0.016% of the survey area has sources missing due to database population procedures, and warp and stack images may carry WCS issues near the pole. Those caveats matter when you’re building distance priors from PS1 photometry alongside Gaia parallaxes. Pan-STARRS1 data archive home page
Gaia data releases and cross-reference notes
Gaia DR3 and its successors provide the backbone for distance scales used in 3D maps. Cross-matching Gaia sources with Pan-STARRS1 DR1 has a known asymmetry in the matching algorithm, which researchers account for in neighborhood analyses like gaiaedr3.panstarrs1_neighbourhood. The cross-match notes emphasize how Gaia’s parallax system interacts with PS1’s photometric filters, and how nearby stacked datasets can bias dust-reddening estimates if not handled carefully. The cross-reference notes are essential to understand where Gaia data ends and PS1 begins in the combined 3D view. The neighborhood metadata page explicitly flags the asymmetry and the imprinting of Gaia’s latest data policy on cross-matches. gaiaedr3.panstarrs1_neighbourhood
Dust-map papers built on Gaia, Pan-STARRS1, and 2MASS
Dust maps in the 3D sense hinge on Gaia parallaxes, Pan-STARRS1 photometry, and 2MASS near-infrared data. A widely cited paper from 2019 shows a 3D reddening map constructed with Gaia, PS1, and 2MASS data, illustrating how dust structures in the local spiral arms warp the extinction distances used to anchor the Milky Way’s vertical structure. The method sets a template for how to blend distance estimates with color-excess measurements across multiple surveys. What the spec sheets actually say is that combining Gaia’s distance scale with PS1’s depth delivers a more coherent dust geometry than either survey alone. arXiv:1905.02734
News and press materials from ESA and university teams
ESA’s communications and university press releases frequently summarize the practical upshot of the Gaia–Pan-STARRS cross-work. Look for ESA videos and articles that emphasize the “most accurate” distance ladders in the Milky Way and cross-archive synergies between Gaia, PS1, and 2MASS. These pieces help translate the technical cross-match challenges into a readable narrative about how dust, distance, and structure are revealed in the 3D map. In addition, university press offices often publish behind-the-scenes notes on data releases and cross-match validations that are useful for readers who want the human side of the data governance. Phys.org Pan-STARRS catalogue of 3 billion astronomical sources
Key takeaway: the map rests on a federation of surveys. PS1 supplies depth, Gaia furnishes distance, and 2MASS closes the infrared gap that dust reddening hides behind. That federation is the story readers will remember when they see a 3D slice of the Milky Way. The cross-checks published across 2016–2019 and the ongoing Gaia data releases establish a steady baseline researchers use to interpret the current 3D atlas. gaiaedr3.panstarrs1_neighbourhood arXiv:1905.02734

A 2026 Pan-STARRS1 3D Milky Way map unlocks a sharper cosmic neighborhood
Pan-STARRS1 continues to refine our 3D portrait of the Milky Way by stitching together multi-epoch imaging with improved parallax inference. What emerges is a more precise skeleton of the Galaxy’s spiral arms and its nearby stellar census. I looked at the latest data releases and the accompanying methodological notes. The results hinge on deeper photometry, better extinction corrections, and cross-matching with external catalogs. The takeaway is not a flash of revolution but a quiet tightening of the map’s spine. The updated 3D view reduces systematic distance errors by a meaningful margin, especially for nearby disk stars, which helps anchor the local velocity field and time-domain studies.
What the new map does next is simple: it invites more zealous cross-checks with Gaia-era results, and it opens room for integrating Pan-STARRS1 data into upcoming time-domain surveys. As the consortium notes, the work is iterative, not ex nihilo. This is a housekeeping update that expands the Milky Way’s census without overhauling the framework.
Readers curious about future use can envision targeted studies of stellar streams, solar neighborhood kinematics, and dusty regions that stubbornly resist simple distance estimates. One question remains practical: how will subsequent releases tighten those parallax zero-points in crowded fields? The path forward is to repeat the calibration with new epochs.
Frequently asked questions
How does pan-starrs1 contribute to the milky way map in 2026
Pan-STARRS1 provides deep, multi-epoch optical photometry that extends the 3D Milky Way map by filling in brightness and color information for millions of stars beyond the Gaia baseline. By combining Pan-STARRS1 measurements with Gaia parallaxes, researchers can improve distance estimates for faint or reddened stars and better trace the Galactic structure. The cross-match helps refine the 3D dust distribution when used with infrared surveys as a color excess proxy. This ensemble yields a more continuous backbone across a larger portion of the sky and to greater distances. Cross-matching and wavelength complementarity are the core drivers behind the 2026 map’s claimed improvements. Yes, this synergy is central to the enhanced depth in 2026. Pan-STARRS1 photometry remains a critical ingredient alongside Gaia.
What is the role of gaia in distance measurements for pan-starrs1
Gaia provides the most precise parallax measurements to date for a vast number of stars, serving as the distance backbone. In practice, Gaia parallaxes anchor the 3D map, and Pan-STARRS1 photometry augments color-magnitude diagrams to extend distance reach where Gaia data are sparse or uncertain. When Gaia parallaxes are noisy or unavailable, Bayesian methods incorporate Pan-STARRS1 colors and Gaia priors to estimate distances, improving the 3D reconstruction with reddening constraints. The result is a consistent distance ladder that blends Gaia’s geometry with Pan-STARRS1’s spectral information. The Gaia parallax is the spine; Pan-STARRS1 fills the limbs.
How do gaia and pan-starrs1 cross-match work
Cross-matching aligns sources across catalogs by position, proper motion, and, when available, photometric signatures. The process accounts for epoch differences, astrometric systematics, and WCS quirks to pair Gaia detections with Pan-STARRS1 entries. Researchers apply probabilistic association, sometimes incorporating 2MASS colors to break degeneracies in crowded regions. The result is a catalog where a Gaia source can be linked to a Pan-STARRS1 counterpart with quantified confidence, enabling consistent distance and reddening estimates across datasets. Association confidence hinges on multi-epoch positioning and color information. Key caveat: asymmetries can bias matches in dense fields.
Which regions of the milky way are best mapped with pan-starrs1 gaia cross-match
The best maps arise where Gaia has high-precision parallaxes and Pan-STARRS1 offers clean optical photometry, notably in high-latitude fields and moderate extinction corridors. Bulge and inner disk regions suffer from crowding and heavy reddening, reducing cross-match completeness. Conversely, halo lines of sight and outer disk areas with lower extinction yield robust matches, enabling clearer 3D dust reconstructions. The map grows bumpier toward the Galactic center, where WCS and crowding challenges bite. Robust cross-matches dominate high-latitude and outer-disk corridors.
What are the main limitations of 3d dust maps using pan-starrs1 gaia
Limitations include incomplete sky coverage in crowded regions, spatially varying extinction laws, and Gaia parallax systematics at faint magnitudes. Pan-STARRS1 photometry can be impacted by saturation for bright stars and calibration offsets across runs. The combination relies on color excess assumptions that may break for peculiar stellar types. Finally, reddening estimates hinge on the fidelity of the dust model itself. Model mismatches propagate into distance errors and layer thickness. These limitations constrain resolution and accuracy, especially near the Galactic center. Dust models are the bottleneck you cannot bypass.
Where can i access pan-starrs1 dr2 data and gaia cross-match catalogs
Pan-STARRS1 DR2 data are accessible through public archives hosted by the Pan-STARRS1 Science Consortium and associated data portals. Gaia cross-match catalogs appear in Gaia data releases and companion cross-match products published by the community, often mirrored in institutional archives and VO services. Users typically download region-based subsets or request bulk queries via the archive’s query interface. The data are accompanied by documentation detailing epoch, photometric systems, and cross-match flags, which are essential for reproducibility. Access is public, with clear provenance in the release notes.
How reliable are photometric measurements in pan-starrs1 for 3d mapping
Pan-STARRS1 photometry is reliable for the survey’s nominal depth, with typical photometric calibrations achieving sub-percent precision in good fields. Systematics rise with crowded fields, faint magnitudes near the detection limit, and during calibration drifts between runs. The photometric stability is sufficient to support reddening estimates when paired with Gaia parallaxes, but users should heed known offsets in specific bands and apply recommended zero-point corrections. Photometry is solid, not perfect.
What papers summarize gaia pan-starrs1 dust mapping
Key papers describe the integration of Gaia and Pan-STARRS1 for 3D dust mapping and reddening reconstruction. They discuss cross-match strategies, distance inference, and the added value of combining optical with infrared data (e.g., 2MASS) for extinction corrections. Readers should look for reviews and method papers around Gaia DR2/DR3 cross-matches with Pan-STARRS1 data, plus follow-ons that address dust maps with improved extinction priors and higher angular resolution. Cross-disciplinary work anchors the updates.
How has the cross-match improved since 2019 in published work
Since 2019, published work shows improvements in cross-match completeness and association confidence, driven by better WCS handling, refined astrometric solutions, and inclusion of multi-band photometry. Advances in probabilistic matching reduce false positives in crowded fields, while improved systemic corrections reduce misalignments between Gaia and Pan-STARRS1 frames. The net effect is a cleaner 3D map with deeper reach and more reliable reddening estimates. Improvements stack, layer by layer.
What is reddening in the context of pan-starrs1 gaia mapping
Reddening describes the dust-induced color change of starlight as it travels through the interstellar medium. In Pan-STARRS1 Gaia mapping, reddening is quantified as color excess by comparing observed colors to intrinsic stellar colors, aided by infrared priors from 2MASS. Correcting for reddening is essential to recover true distances and to map the dust distribution in 3D. The process harmonizes photometry with a dust model to separate distance effects from extinction. Reddening is the compass for the map’s depth.
How do 2mass data contribute to the dust map alongside pan-starrs1 and gaia
2MASS adds the infrared color information needed to break degeneracies in optical colors caused by dust. By extending the wavelength baseline, 2MASS helps constrain the extinction curve and improves estimates of intrinsic stellar colors. In practice, 2MASS acts as an anchoring prior when Gaia parallaxes are uncertain or when Pan-STARRS1 colors alone cannot disambiguate reddened stars. The trio, Gaia, Pan-STARRS1, and 2MASS, yields tighter 3D reddening maps. Infrared priors stabilize the color space.
Are there known systematic errors in the pan-starrs1 gaia cross-match
Yes. Systematics include epoch differences that misplace fast-moving stars, crowded-field confusion near the Galactic plane, and residual photometric calibration offsets between surveys. Astrometric systematics in Gaia at faint magnitudes can propagate into distance estimates, while WCS quirks sometimes bias small angular separations. Careful modeling and flagging of dubious matches mitigate these issues, but residuals remain a limiting factor in dense regions. Systematics cap the map’s fidelity in crowded zones.
What future surveys might augment the pan-starrs1 gaia 3d map
Future surveys could include deeper optical and near-infrared programs that push to fainter magnitudes, higher astrometric precision, and broader wavelength coverage. Projects to watch include Gaia successor missions, LSST-like deep-wide surveys, and dedicated infrared all-sky mapping. These efforts would extend reach, boost cross-match reliability, and refine the reddening model with more robust color baselines. The next generation sharpens both depth and accuracy.
How can students reproduce pan-starrs1 gaia cross-match results
Students should start by obtaining public Gaia data releases and Pan-STARRS1 DR2 data, then apply the published cross-match algorithms or use community-provided cross-match catalogs. Reproduce distance estimates by combining Gaia parallaxes with Pan-STARRS1 colors, and validate reddening via comparison to 2MASS-based extinction priors. Document the epoch corrections, apply quality cuts, and share code alongside a data subset to demonstrate reproducibility. Transparency and code sharing unlock replication.
What are the best resources to learn about 3d maps of the milky way
Begin with review articles that summarize Gaia’s distance ladder, Pan-STARRS1 photometry, and 3D dust modeling. Follow up with data-release papers for Gaia and Pan-STARRS1, then landscape overviews that discuss cross-match strategies, reddening estimation, and multi-wavelength integration. Finally, read recent case studies applying these maps to spiral-arm structure and dust distribution in the Milky Way. Foundational papers establish the framework. New works push the boundaries.